
Predicting Progress: A Pilot of Expected Utility Forecasting in Science Funding
Read more about expected utility forecasting and science funding innovation here.
The current process that federal science agencies use for reviewing grant proposals is known to be biased against riskier proposals. As such, the metascience community has proposed many alternate approaches to evaluating grant proposals that could improve science funding outcomes. One such approach was proposed by Chiara Franzoni and Paula Stephan in a paper on how expected utility — a formal quantitative measure of predicted success and impact — could be a better metric for assessing the risk and reward profile of science proposals. Inspired by their paper, the Federation of American Scientists (FAS) collaborated with Metaculus to run a pilot study of this approach. In this working paper, we share the results of that pilot and its implications for future implementation of expected utility forecasting in science funding review.
Brief Description of the Study
In fall 2023, we recruited a small cohort of subject matter experts to review five life science proposals by forecasting their expected utility. For each proposal, this consisted of defining two research milestones in consultation with the project leads and asking reviewers to make three forecasts for each milestone:
- the probability of success;
- The scientific impact of the milestone, if it were reached; and
- The social impact of the milestone, if it were reached.
These predictions can then be used to calculate the expected utility, or likely impact, of a proposal and design and compare potential portfolios.
Key Takeaways for Grantmakers and Policymakers
The three main strengths of using expected utility forecasting to conduct peer review are
- For reviewers, it’s a relatively light-touch approach that encourages rigor and reduces anti-risk bias in scientific funding.
- The review criteria allow program managers to better understand the risk-reward profile of their grant portfolios and more intentionally shape them according to programmatic goals.
- Quantitative forecasts are resolvable, meaning that program officers can compare the actual outcomes of funded proposals with reviewers’ predictions. This generates a feedback/learning loop within the peer review process that incentivizes reviewers to improve the accuracy of their assessments over time.
Despite the apparent complexity of this process, we found that first-time users were able to successfully complete their review according to the guidelines without any additional support. Most of the complexity occurs behind-the-scenes, and either aligns with the responsibilities of the program manager (e.g., defining milestones and their dependencies) or can be automated (e.g., calculating the total expected utility). Thus, grantmakers and policymakers can have confidence in the user friendliness of expected utility forecasting.
How Can NSF or NIH Run an Experiment on Expected Utility Forecasting?
An initial pilot study could be conducted by NSF or NIH by adding a short, non-binding expected utility forecasting component to a selection of review panels. In addition to the evaluation of traditional criteria, reviewers would be asked to predict the success and impact of select milestones for the proposals assigned to them. The rest of the review process and the final funding decisions would be made using the traditional criteria.
Afterwards, study facilitators could take the expected utility forecasting results and construct an alternate portfolio of proposals that would have been funded if that approach was used, and compare the two portfolios. Such a comparison would yield valuable insights into whether—and how—the types of proposals selected by each approach differ, and whether their use leads to different considerations arising during review. Additionally, a pilot assessment of reviewers’ prediction accuracy could be conducted by asking program officers to assess milestone achievement and study impact upon completion of funded projects.
Findings and Recommendations
Reviewers in our study were new to the expected utility forecasting process and gave generally positive reactions. In their feedback, reviewers said that they appreciated how the framing of the questions prompted them to think about the proposals in a different way and pushed them to ground their assessments with quantitative forecasts. The focus on just three review criteria–probability of success, scientific impact, and social impact–was seen as a strength because it simplified the process, disentangled feasibility from impact, and eliminated biased metrics. Overall, reviewers found this new approach interesting and worth investigating further.
In designing this pilot and analyzing the results, we identified several important considerations for planning such a review process. While complex, engaging with these considerations tended to provide value by making implicit project details explicit and encouraging clear definition and communication of evaluation criteria to reviewers. Two key examples are defining the proposal milestones and creating impact scoring systems. In both cases, reducing ambiguities in terms of the goals that are to be achieved, developing an understanding of how outcomes depend on one another, and creating interpretable and resolvable criteria for assessment will help ensure that the desired information is solicited from reviewers.
Questions for Further Study
Our pilot only simulated the individual review phase of grant proposals and did not simulate a full review committee. The typical review process at a funding agency consists of first, individual evaluations by assigned reviewers, then discussion of those evaluations by the whole review committee, and finally, the submission of final scores from all members of the committee. This is similar to the Delphi method, a structured process for eliciting forecasts from a panel of experts, so we believe that it would work well with expected utility forecasting. The primary change would therefore be in the definition and approach for eliciting criterion scores, rather than the structure of the review process. Nevertheless, future implementations may uncover additional considerations that need to be addressed or better ways to incorporate forecasting into a panel environment.
Further investigation into how best to define proposal milestones is also needed. This includes questions such as, who should be responsible for determining the milestones? If reviewers are involved, at what part(s) of the review process should this occur? What is the right balance between precision and flexibility of milestone definitions, such that the best outcomes are achieved? How much flexibility should there be in the number of milestones per proposal?
Lastly, more thought should be given to how to define social impact and how to calibrate reviewers’ interpretation of the impact score scale. In our report, we propose a couple of different options for calibrating impact, in addition to describing the one we took in our pilot.
Interested grantmakers, both public and private, and policymakers are welcome to reach out to our team if interested in learning more or receiving assistance in implementing this approach.
Introduction
The fundamental concern of grantmakers, whether governmental or philanthropic, is how to make the best funding decisions. All funding decisions come with inherent uncertainties that may pose risks to the investment. Thus, a certain level of risk-aversion is natural and even desirable in grantmaking institutions, especially federal science agencies which are responsible for managing taxpayer dollars. However, without risk, there is no reward, so the trade-off must be balanced. In mathematics and economics, expected utility is the common metric assumed to underlie all rational decision making. Expected utility has two components: the probability of an outcome occurring if an action is taken and the value of that outcome, which roughly corresponds with risk and reward. Thus, expected utility would seem to be a logical choice for evaluating science funding proposals.
In the debates around funding innovation though, expected utility has largely flown under the radar compared to other ideas. Nevertheless, Chiara Franzoni and Paula Stephan have proposed using expected utility in peer review. Building off of their paper, the Federation of American Scientists (FAS) developed a detailed framework for how to implement expected utility into a peer review process. We chose to frame the review criteria as forecasting questions, since determining the expected utility of a proposal inherently requires making some predictions about the future. Forecasting questions also have the added benefit of being resolvable–i.e., the true outcome can be determined after the fact and compared to the prediction–which provides a learning opportunity for reviewers to improve their abilities and identify biases. In addition to forecasting, we incorporated other unique features, like an exponential scale for scoring impact, that we believe help reduce biases against risky proposals.
With the theory laid out, we conducted a small pilot in fall of 2023. The pilot was run in collaboration with Metaculus, a crowd forecasting platform and aggregator, to leverage their expertise in designing resolvable forecasting questions and to use their platform to collect forecasts from reviewers. The purpose of the pilot was to test the mechanics of this approach in practice, see if there are any additional considerations that need to be thought through, and surface potential issues that need to be solved for. We were also curious if there would be any interesting or unexpected results that arise based on how we chose to calculate impact and total expected utility. It is important to note that this pilot was not an experiment, so we did not have a control group to compare the results of the review with.
Since FAS is not a grantmaking institution, we did not have a ready supply of traditional grant proposals to use. Instead, we used a set of two-page research proposals for Focused Research Organizations (FROs) that we had sourced through separate advocacy work in that area.1 With the proposal authors’ permission, we recruited a cohort of twenty subject matter experts to each review one of five proposals. For each proposal, we defined two research milestones in consultation with the proposal authors. Reviewers were asked to make three forecasts for each milestone:
- The probability of success;
- The scientific impact, conditional on success; and
- The social impact, conditional on success.
Reviewers submitted their forecasts on Metaculus’ platform; in a separate form they provided explanations for their forecasts and responded to questions about their experience and impression of this new approach to proposal evaluation. (See Appendix A for details on the pilot study design.)
Insights from Reviewer Feedback
Overall, reviewers liked the framing and criteria provided by the expected utility approach, while their main critique was of the structure of the research proposals. Excluding critiques of the research proposal structure, which are unlikely to apply to an actual grant program, two thirds of the reviewers expressed positive opinions of the review process and/or thought it was worth pursuing further given drawbacks with existing review processes. Below, we delve into the details of the feedback we received from reviewers and their implications for future implementation.
Feedback on Review Criteria
Disentangling Impact from Feasibility
Many of the reviewers said that this model prompted them to think differently about how they assess the proposals and that they liked the new questions. Reviewers appreciated that the questions focused their attention on what they think funding agencies really want to know and nothing more: “can it occur?” and “will it matter?” This approach explicitly disentangles impact from feasibility: “Often, these two are taken together, and if one doesn’t think it is likely to succeed, the impact is also seen as lower.” Additionally, the emphasis on big picture scientific and social impact “is often missing in the typical review process.” Reviewers also liked that this approach eliminates what they consider biased metrics, such as the principal investigator’s reputation, track record, and “excellence.”
Reducing Administrative Burden
The small set of questions was seen as more efficient and less burdensome on reviewers. One reviewer said, “I liked this approach to scoring a proposal. It reduces the effort to thinking about perceived impact and feasibility.” Another reviewer said, “On the whole it seems a worthwhile exercise as the current review processes for proposals are onerous.”
Quantitative Forecasting
Reviewers saw benefits to being asked to quantify their assessments, but also found it challenging at times. A number of reviewers enjoyed taking a quantitative approach and thought that it helped them be more grounded and explicit in their evaluations of the proposals. However, some reviewers were concerned that it felt like guesswork and expressed low confidence in their quantitative assessments, primarily due to proposals lacking details on their planned research methods, which is an issue discussed in the section “Feedback on Proposals.” Nevertheless, some of these reviewers still saw benefits to taking a quantitative approach: “It is interesting to try to estimate probabilities, rather than making flat statements, but I don’t think I guess very well. It is better than simply classically reviewing the proposal [though].” Since not all academics have experience making quantitative predictions, we expect that there will be a learning curve for those new to the practice. Forecasting is a skill that can be learned though, and we think that with training and feedback, reviewers can become better, more confident forecasters.
Defining Social Impact
Of the three types of questions that reviewers were asked to answer, the question about social impact seemed the harder one for reviewers to interpret. Reviewers noted that they would have liked more guidance on what was meant by social impact and whether that included indirect impacts. Since questions like these are ultimately subjective, the “right” definition of social impact and what types of outcomes are considered most valuable will depend on the grantmaking institution, their domain area, and their theory of change, so we leave this open to future implementers to clarify in their instructions.
Calibrating Impact
While the impact score scale (see Appendix A) defines the relative difference in impact between scores, it does not define the absolute impact conveyed by a score. For this reason, a calibration mechanism is necessary to provide reviewers with a shared understanding of the use and interpretation of the scoring system. Note that this is a challenge that rubric-based peer review criteria used by science agencies also face. Discussion and aggregation of scores across a review committee helps align reviewers and average out some of this natural variation.2
To address this, we surveyed a small, separate set of academics in the life sciences about how they would score the social and scientific impact of the average NIH R01 grant, which many life science researchers apply to and review proposals for. We then provided the average scores from this survey to reviewers to orient them to the new scale and help them calibrate their scores.
One reviewer suggested an alternative approach: “The other thing I might change is having a test/baseline question for every reviewer to respond to, so you can get a feel for how we skew in terms of assessing impact on both scientific and social aspects.” One option would be to ask reviewers to score the social and scientific impact of the average grant proposal for a grant program that all reviewers would be familiar with; another would be to ask reviewers to score the impact of the average funded grant for a specific grant program, which could be more accessible for new reviewers who have not previously reviewed grant proposals. A third option would be to provide all reviewers on a committee with one or more sample proposals to score and discuss, in a relevant and shared domain area.
When deciding on an approach for calibration, a key consideration is the specific resolution criteria that are being used — i.e., the downstream measures of impact that reviewers are being asked to predict. One option, which was used in our pilot, is to predict the scores that a comparable, but independent, panel of reviewers would give the project some number of years following its successful completion. For a resolution criterion like this one, collecting and sharing calibration scores can help reviewers get a sense for not just their own approach to scoring, but also those of their peers.
Making Funding Decisions
In scoring the social and scientific impact of each proposal, reviewers were asked to assess the value of the proposal to society or to the scientific field. That alone would be insufficient to determine whether a proposal should be funded though, since it would need to be compared with other proposals in conjunction with its feasibility. To do so, we calculated the total expected utility of each proposal (see Appendix C). In a real funding scenario, this final metric could then be used to compare proposals and determine which ones get funded. Additionally, unlike a traditional scoring system, the expected utility approach allows for the detailed comparison of portfolios — including considerations like the expected proportion of milestones reached and the range of likely impacts.
In our pilot, reviewers were not informed that we would be doing this additional calculation based on their submissions. As a result, one reviewer thought that the questions they were asked failed to include other important questions, like “should it occur?” and “is it worth the opportunity cost?” Though these questions were not asked of reviewers explicitly, we believe that they would be answered once the expected utility of all proposals is calculated and considered, since the opportunity cost of one proposal would be the expected utility of the other proposals. Since each reviewer only provided input on one proposal, they may have felt like the scores they gave would be used to make a binary yes/no decision on whether to fund that one proposal, rather than being considered as a part of a larger pool of proposals, as it would be in a real review process.
Feedback on Proposals
Missing Information Impedes Forecasting
The primary critique that reviewers expressed was that the research proposals lacked details about their research plans, what methods and experimental protocols would be used, and what preliminary research the author(s) had done so far. This hindered their ability to properly assess the technical feasibility of the proposals and their probability of success. A few reviewers expressed that they also would have liked to have had a better sense of who would be conducting the research and each team member’s responsibilities. These issues arose because the FRO proposals used in our pilot had not originally been submitted for funding purposes, and thus lacked the requirements of traditional grant proposals, as we noted above. We assume this would not be an issue with proposals submitted to actual grantmakers.3
Improving Milestone Design
A few reviewers pointed out that some of the proposal milestones were too ambiguous or were not worded specifically enough, such that there were ways that researchers could technically say that they had achieved the milestone without accomplishing the spirit of its intent. This made it more challenging for reviewers to assess milestones, since they weren’t sure whether to focus on the ideal (i.e., more impactful) interpretation of the milestone or to account for these “loopholes.” Moreover, loopholes skew the forecasts, since they increase the probability of achieving a milestone, while lowering the impact of doing so if it is achieved through a loophole.
One reviewer suggested, “I feel like the design of milestones should be far more carefully worded – or broken up into sub-sentences/sub-aims, to evaluate the feasibility of each. As the questions are currently broken down, I feel they create a perverse incentive to create a vaguer milestone, or one that can be more easily considered ‘achieved’ for some ‘good enough’ value of achieved.” For example, they proposed that one of the proposal milestones, “screen a library of tens of thousands of phage genes for enterobacteria for interactions and publish promising new interactions for the field to study,” could be expanded to
- “Generate a library of tens of thousands of genes from enterobacteria, expressed in E. coli
- “Validate their expression under screenable conditions
- “Screen the library for their ability to impede phage infection with a panel of 20 type phages
- “Publish …
- “Store and distribute the library, making it as accessible to the broader community”
We agree with the need for careful consideration and design of milestones, given that “loopholes” in milestones can detract from their intended impact and make it harder for reviewers to accurately assess their likelihood. In our theoretical framework for this approach, we identified three potential parties that could be responsible for defining milestones: (1) the proposal author(s), (2) the program manager, with or without input from proposal authors, or (3) the reviewers, with or without input from proposal authors. This critique suggests that the first approach of allowing proposal authors to be the sole party responsible for defining proposal milestones is vulnerable to being gamed, and the second or third approach would be preferable. Program managers who take on the task of defining milestones should have enough expertise to think through the different potential ways of fulfilling a milestone and make sure that they are sufficiently precise for reviewers to assess.
Benefits of Flexibility in Milestones
Some flexibility in milestones may still be desirable, especially with respect to the actual methodology, since experimentation may be necessary to determine the best technique to use. For example, speaking about the feasibility of a different proposal milestone – “demonstrate that Pro-AG technology can be adapted to a single pathogenic bacterial strain in a 300 gallon aquarium of fish and successfully reduce antibiotic resistance by 90%” – a reviewer noted that
“The main complexity and uncertainty around successful completion of this milestone arises from the native fish microbiome and whether a CRISPR delivery tool can reach the target strain in question. Due to the framing of this milestone, should a single strain be very difficult to reach, the authors could simply switch to a different target strain if necessary. Additionally, the mode of CRISPR delivery is not prescribed in reaching this milestone, so the authors have a host of different techniques open to them, including conjugative delivery by a probiotic donor or delivery by engineered bacteriophage.”
Peer Review Results
Sequential Milestones vs. Independent Outcomes
In our expected utility forecasting framework, we defined two different ways that a proposal could structure its outcomes: as sequential milestones where each additional milestone builds off of the success of the previous one, or as independent outcomes where the success of one is not dependent on the success of the other(s). For proposals with sequential milestones in our pilot, we would expect the probability of success of milestone 2 to be less than the probability of success of milestone 1 and for the opposite to be true of their impact scores. For proposals with independent outcomes, we do not expect there to be a relationship between the probability of success and the impact scores of milestones 1 and 2. There are different equations for calculating the total expected utility, depending on the relationship between outcomes (see Appendix C).
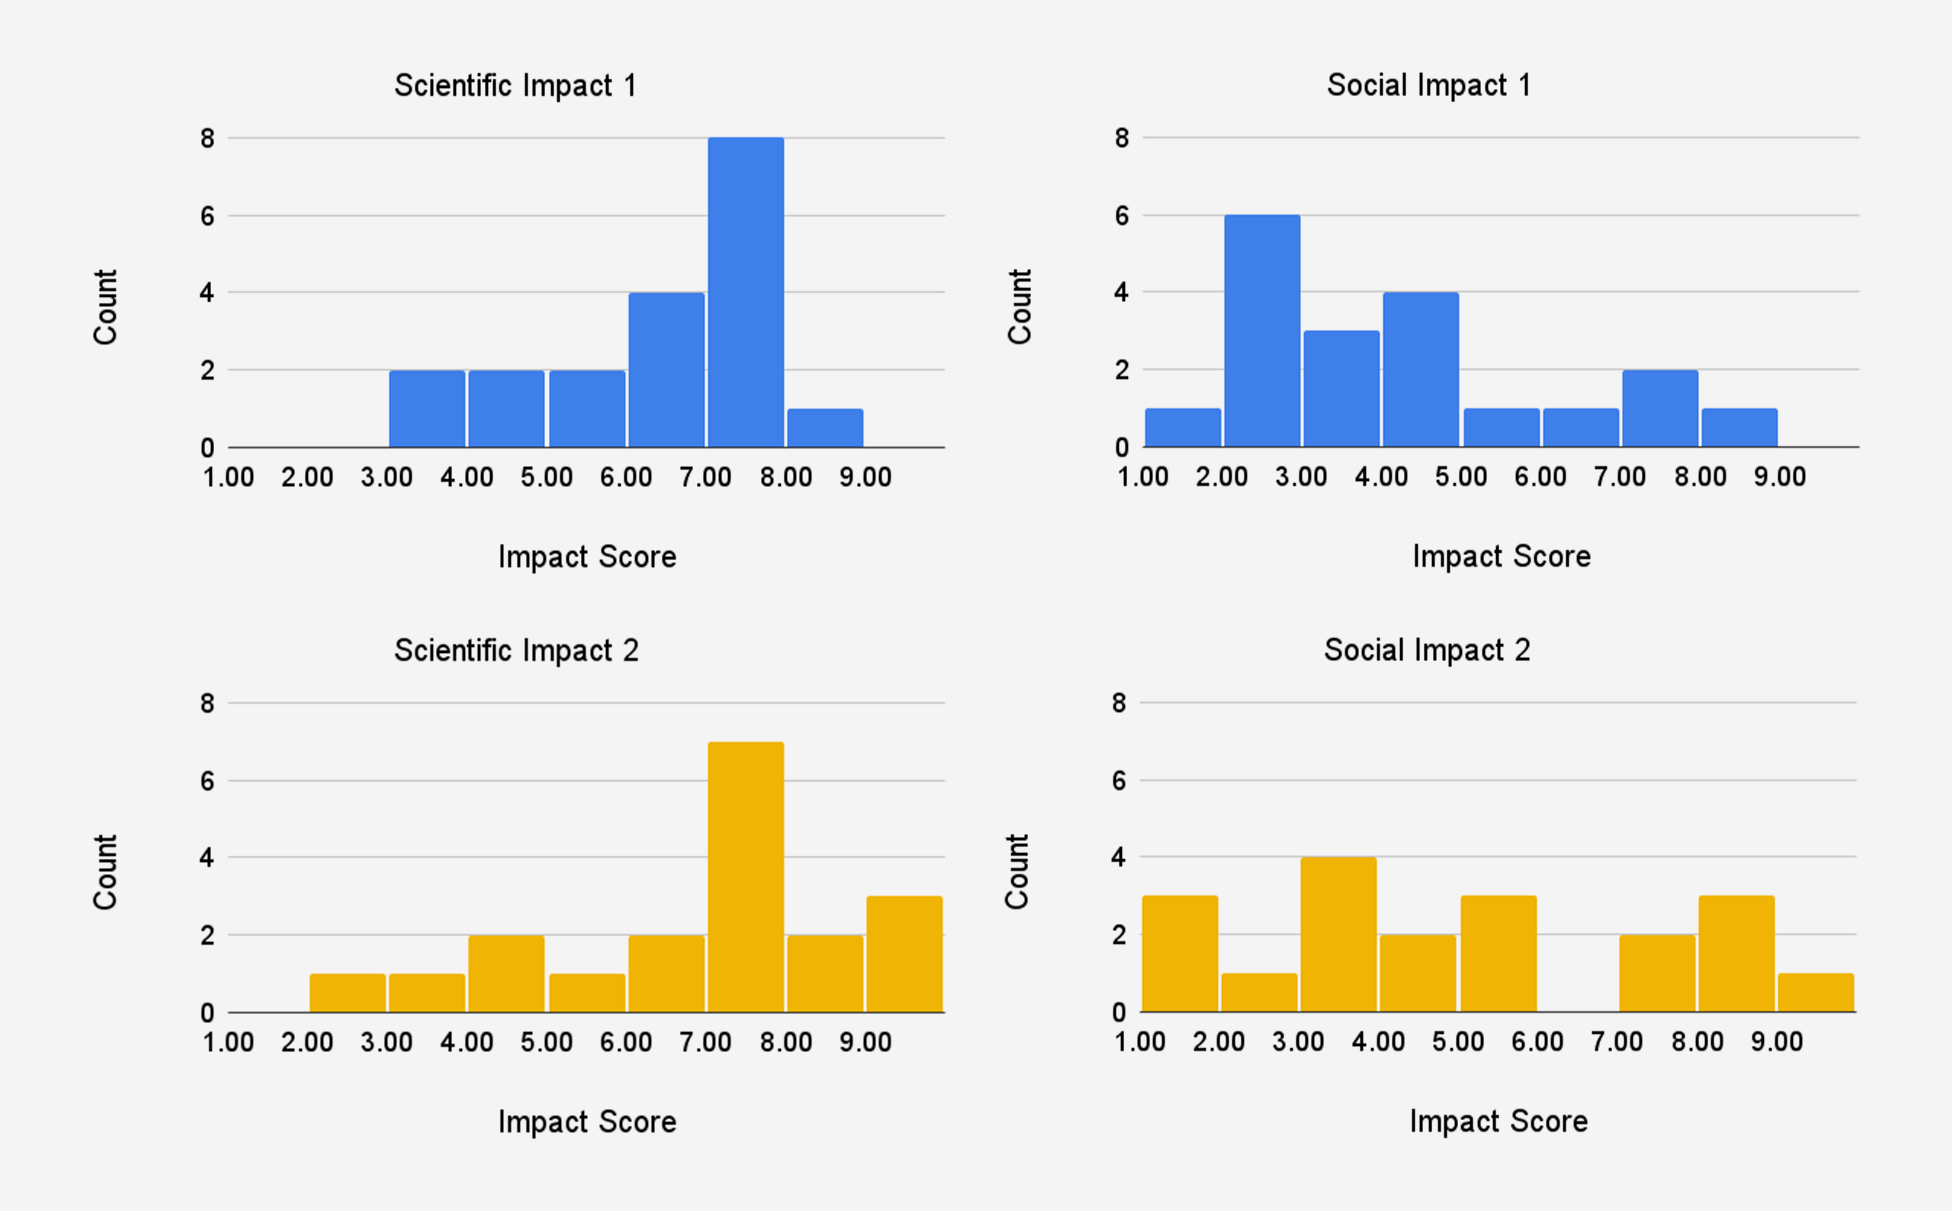
For each of the proposals in our study, we categorized them based on whether they had sequential milestones or independent outcomes. This information was not shared with reviewers. Table 1 presents the average reviewer forecasts for each proposal. In general, milestones received higher scientific impact scores than social impact scores, which makes sense given the primarily academic focus of research proposals. For proposals 1 to 3, the probability of success of milestone 2 was roughly half of the probability of success of milestone 1; reviewers also gave milestone 2 higher scientific and social impact scores than milestone 1. This is consistent with our categorization of proposals 1 to 3 as sequential milestones.
Further Discussion on Designing and Categorizing Milestones
We originally categorized proposal 4’s milestones as sequential, but one reviewer gave milestone 2 a lower scientific impact score than milestone 1 and two reviewers gave it a lower social impact score. One reviewer also gave milestone 2 roughly the same probability of success as milestone 1. This suggests that proposal 4’s milestones can’t be considered strictly sequential.
The two milestones for proposal 4 were
- Milestone 1: Develop a tool that is able to perturb neurons in C. elegans and record from all neurons simultaneously, automated w/ microfluidics, and
- Milestone 2: Develop a model of the C. elegans nervous system that can predict what every neuron will do when stimulating one neuron with R2 > 0.8
The reviewer who gave milestone 2 a lower scientific impact score explained: “Given the wording of the milestone, I do not believe that if the scientific milestone was achieved, it would greatly improve our understanding of the brain.” Unlike proposals 1-3, in which milestone 2 was a scaled-up or improved-upon version of milestone 1, these milestones represent fundamentally different categories of output (general-purpose tool vs specific model). Thus, despite the necessity of milestone 1’s tool for achieving milestone 2, the reviewer’s response suggests that the impact of milestone 2 was being considered separately rather than cumulatively.
To properly address this case of sequential milestones with different types of outputs, we recommend that for all sequential milestones, latter milestones should be explicitly defined as inclusive of prior milestones. In the above example, this would imply redefining milestone 2 as “Complete milestone 1 and develop a model of the C. elegans nervous system…” This way, reviewers know to include the impact of milestone 1 in their assessment of the impact of milestone 2.
To help ensure that reviewers are aligned with program managers in how they interpret the proposal milestones (if they aren’t directly involved in defining milestones), we suggest that either reviewers be informed of how program managers are categorizing the proposal outputs so they can conduct their review accordingly or allow reviewers to decide the category (and thus how the total expected utility is calculated), whether individually or collectively or both.
We chose to use only two of the goals that proposal authors provided because we wanted to standardize the number of milestones across proposals. However, this may have provided an incomplete picture of the proposals’ goals, and thus an incomplete assessment of the proposals. We recommend that future implementations be flexible and allow the number of milestones to be determined based on each proposal’s needs. This would also help accommodate one of the reviewers’ suggestion that some milestones should be broken down into intermediary steps.
Importance of Reviewer Explanations
As one can tell from the above discussion, reviewers’ explanation of their forecasts were crucial to understanding how they interpreted the milestones. Reviewers’ explanations varied in length and detail, but the most insightful responses broke down their reasoning into detailed steps and addressed (1) ambiguities in the milestone and how they chose to interpret ambiguities if they existed, (2) the state of the scientific field and the maturity of different techniques that the authors propose to use, and (3) factors that improve the likelihood of success versus potential barriers or challenges that would need to be overcome.
Exponential Impact Scales Better Reflect the Real Distribution of Impact
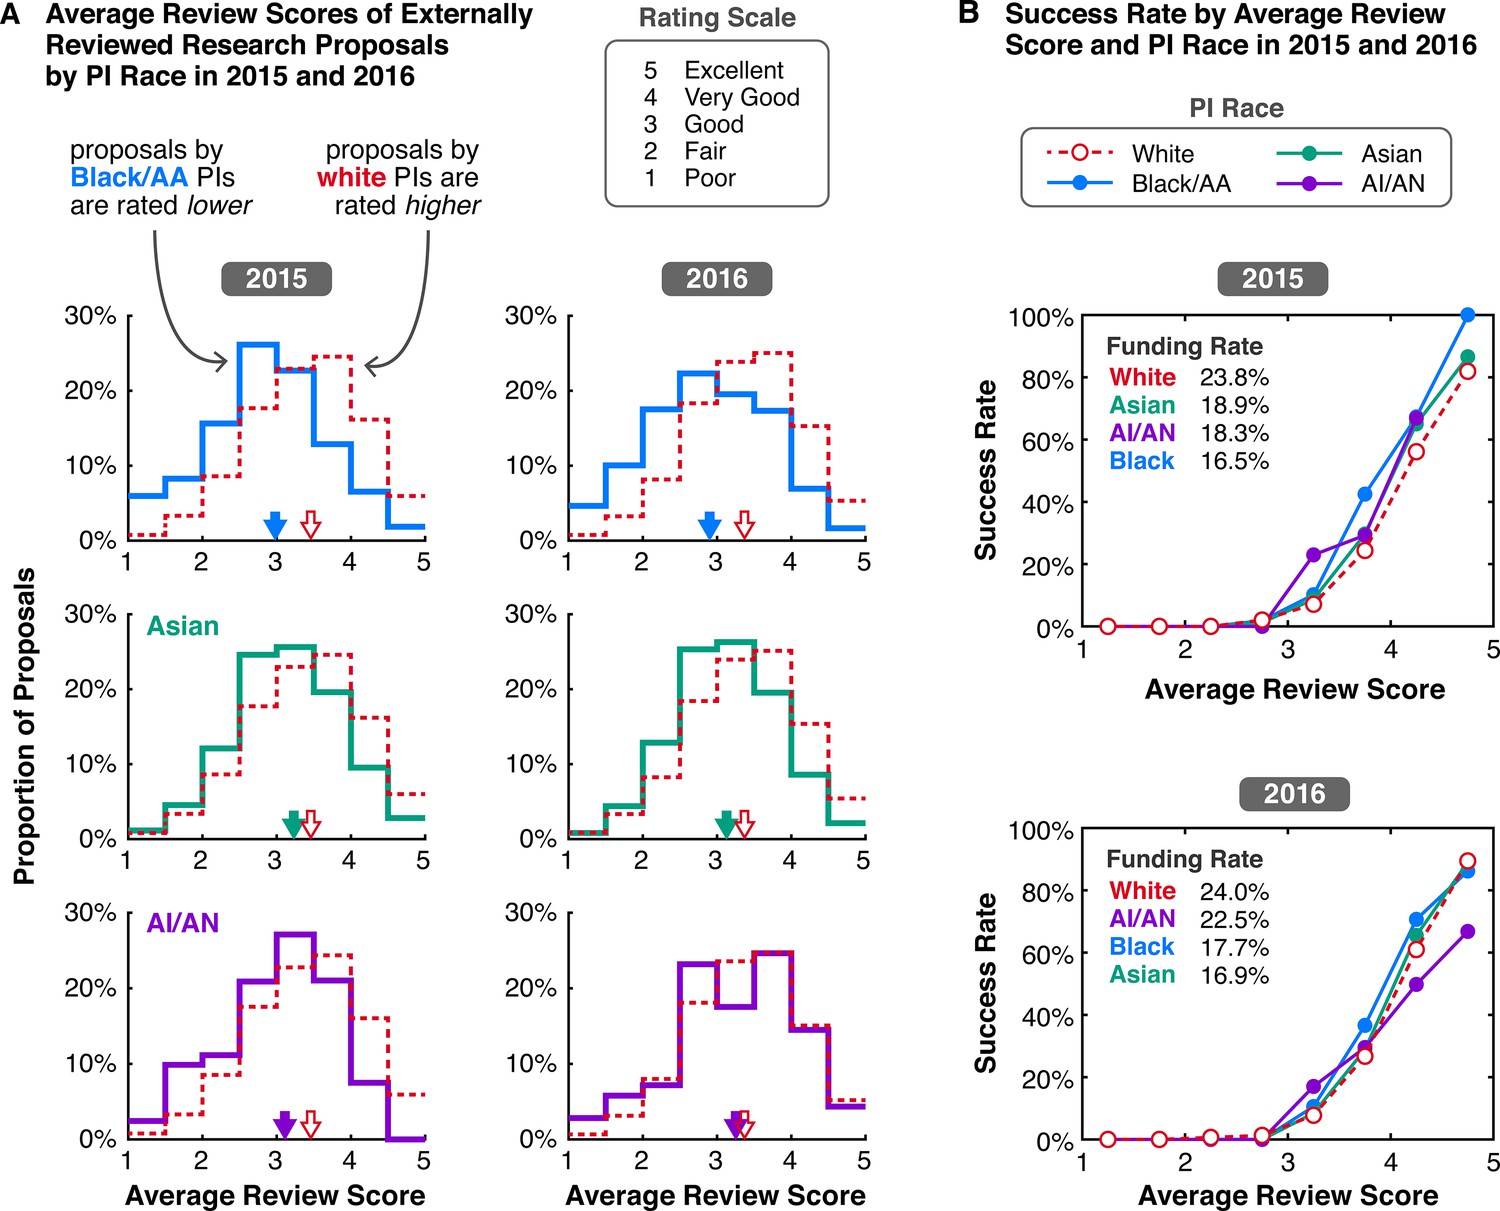
The distribution of NIH and NSF proposal peer review scores tends to be skewed such that most proposals are rated above the center of the scale and there are few proposals rated poorly. However, other markers of scientific impact, such as citations (even with all of its imperfections), tend to suggest a long tail of studies with high impact. This discrepancy suggests that traditional peer review scoring systems are not well-structured to capture the nonlinearity of scientific impact, resulting in score inflation. The aggregation of scores at the top end of the scale also means that very negative scores have a greater impact than very positive scores when averaged together, since there’s more room between the average score and the bottom end of the scale. This can generate systemic bias against more controversial or risky proposals.
In our pilot, we chose to use an exponential scale with a base of 2 for impact to better reflect the real distribution of scientific impact. Using this exponential impact scale, we conducted a survey of a small pool of academics in the life sciences about how they would rate the impact of the average funded NIH R01 grant. They responded with an average scientific impact score 5 and an average social impact score of 3, which are much lower on our scale compared to traditional peer review scores4, suggesting that the exponential scale may be beneficial for avoiding score inflation and bunching at the top. In our pilot, the distribution of scientific impact scores was centered higher than 5, but still less skewed than NIH peer review scores for significance and innovation typically are. This partially reflects the fact that proposals were expected to be funded at one to two orders of magnitude more than NIH R01 proposals are, so impact should also be greater. The distribution of social impact scores exhibits a much wider spread and lower center.
Conclusion
In summary, expected utility forecasting presents a promising approach to improving the rigor of peer review and quantitatively defining the risk-reward profile of science proposals. Our pilot study suggests that this approach can be quite user-friendly for reviewers, despite its apparent complexity. Further study into how best to integrate forecasting into panel environments, define proposal milestones, and calibrate impact scales will help refine future implementations of this approach.
More broadly, we hope that this pilot will encourage more grantmaking institutions to experiment with innovative funding mechanisms. Reviewers in our pilot were more open-minded and quick-to-learn than one might expect and saw significant value in this unconventional approach. Perhaps this should not be so much of a surprise given that experimentation is at the heart of scientific research.
Interested grantmakers, both public and private, and policymakers are welcome to reach out to our team if interested in learning more or receiving assistance in implementing this approach.
Acknowledgements
Many thanks to Jordan Dworkin for being an incredible thought partner in designing the pilot and providing meticulous feedback on this report. Your efforts made this project possible!
Appendix A: Pilot Study Design
Our pilot study consisted of five proposals for life science-related Focused Research Organizations (FROs). These proposals were solicited from academic researchers by FAS as part of our advocacy for the concept of FROs. As such, these proposals were not originally intended as proposals for direct funding, and did not have as strict content requirements as traditional grant proposals typically do. Researchers were asked to submit one to two page proposals discussing (1) their research concept, (2) the motivation and its expected social and scientific impact, and (3) the rationale for why this research can not be accomplished through traditional funding channels and thus requires a FRO to be funded.
Permission was obtained from proposal authors to use their proposals in this study. We worked with proposal authors to define two milestones for each proposal that reviewers would assess: one that they felt confident that they could achieve and one that was more ambitious but that they still thought was feasible. In addition, due to the brevity of the proposals, we included an additional 1-2 pages of supplementary information and scientific context. Final drafts of the milestones and supplementary information were provided to authors to edit and approve. Because this pilot study could not provide any actual funding to proposal authors, it was not possible to solicit full length research proposals from proposal authors.
We recruited four to six reviewers for each proposal based on their subject matter expertise. Potential participants were recruited over email with a request to help review a FRO proposal related to their area of research. They were informed that the review process would be unconventional but were not informed of the study’s purpose. Participants were offered a small monetary compensation for their time.
Confirmed participants were sent instructions and materials for the review process on the same day and were asked to complete their review by the same deadline a month and a half later. Reviewers were told to assume that, if funded, each proposal would receive $50 million in funding over five years to conduct the research, consistent with the proposed model for FROs. Each proposal had two technical milestones, and reviewers were asked to answer the following questions for each milestone:
- Assuming that the proposal is funded by 2025, will the milestone be achieved before 2031?
- What will be the average scientific impact score, as judged in 2032, of accomplishing the milestone?
- What will be the average social impact score, as judged in 2032, of accomplishing the milestone?
The impact scoring system was explained to reviewers as follows:
Please consider the following in determining the impact score: the current and expected long-term social or scientific impact of a funded FRO’s outputs if a funded FRO accomplishes this milestone before 2030.
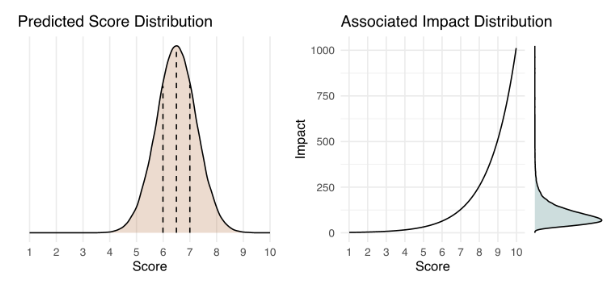
The impact score we are using ranges from 1 (low) to 10 (high). It is base 2 exponential, meaning that a proposal that receives a score of 5 has double the impact of a proposal that receives a score of 4, and quadruple the impact of a proposal that receives a score of 3. In a small survey we conducted of SMEs in the life sciences, they rated the scientific and social impact of the average NIH R01 grant — a federally funded research grant that provides $1-2 million for a 3-5 year endeavor — on this scale to be 5.2 ± 1.5 and 3.1 ± 1.3, respectively. The median scores were 4.75 and 3.00, respectively.
Below is an example of how a predicted impact score distribution (left) would translate into an actual impact distribution (right). You can try it out yourself with this interactive version (in the menu bar, click Runtime > Run all) to get some further intuition on how the impact score works. Please note that this is meant solely for instructive purposes, and the interface is not designed to match Metaculus’ interface.
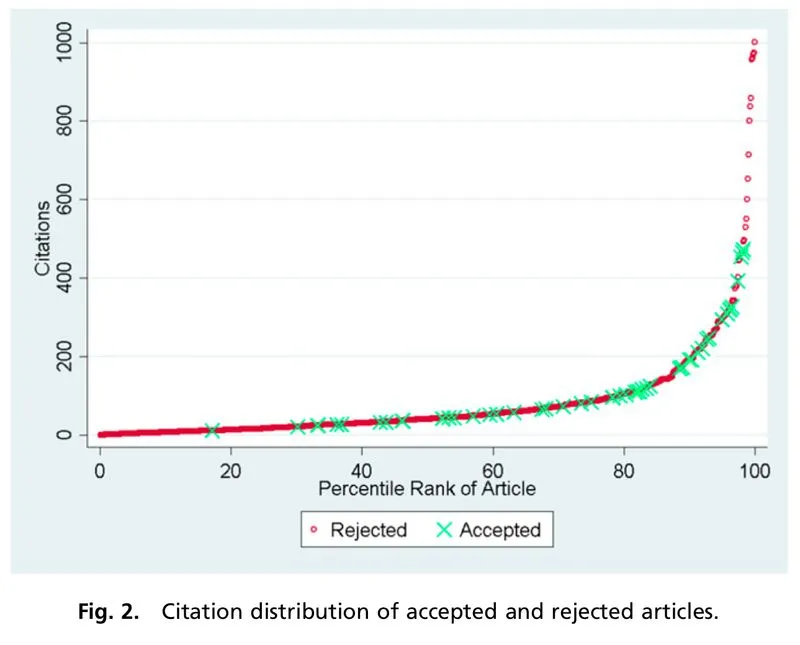
The choice of an exponential impact scale reflects the tendency in science for a small number of research projects to have an outsized impact. For example, studies have shown that the relationship between the number of citations for a journal article and its percentile rank scales exponentially.
Scientific impact aims to capture the extent to which a project advances the frontiers of knowledge, enables new discoveries or innovations, or enhances scientific capabilities or methods. Though each is imperfect, one could consider citations of papers, patents on tools or methods, or users of software or datasets as proxies of scientific impact.
Social impact aims to capture the extent to which a project contributes to solving important societal problems, improving well-being, or advancing social goals. Some proxy metrics that one might use to assess a project’s social impact are the value of lives saved, the cost of illness prevented, the number of job-years of employment generated, economic output in terms of GDP, or the social return on investment.
You may consider any or none of these proxy metrics as a part of your assessment of the impact of a FRO accomplishing this milestone.
Reviewers were asked to submit their forecasts on Metaculus’ website and to provide their reasoning in a separate Google form. For question 1, reviewers were asked to respond with a single probability. For questions 2 and 3, reviewers were asked to provide their median, 25th percentile, and 75th percentile predictions, in order to generate a probability distribution. Metaculus’ website also included information on the resolution criteria of each question, which provided guidance to reviewers on how to answer the question. Individual reviewers were blind to other reviewers’ responses until after the submission deadline, at which point the aggregated results of all of the responses were made public on Metaculus’ website.
Additionally, in the Google form, reviewers were asked to answer a survey question about their experience: “What did you think about this review process? Did it prompt you to think about the proposal in a different way than when you normally review proposals? If so, how? What did you like about it? What did you not like? What would you change about it if you could?”
Some participants did not complete their review. We received 19 complete reviews in the end, with each proposal receiving three to six reviews.
Study Limitations
Our pilot study had certain limitations that should be noted. Since FAS is not a grantmaking institution, we could not completely reproduce the same types of research proposals that a grantmaking institution would receive nor the entire review process. We will highlight these differences in comparison to federal science agencies, which are our primary focus.
- Review Process: There are typically two phases to peer review at NIH and NSF. First, at least three individual reviewers with relevant subject matter expertise are assigned to read and evaluate a proposal independently. Then, a larger committee of experts is convened. There, the assigned reviewers present the proposal and their evaluation, and then the committee discusses and determines the final score for the proposal. Our pilot study only attempted to replicate the first phase of individual review.
- Sample Size: In our pilot, the sample size was quite small, since only five proposals were reviewed, and they were all in different subfields, so different reviewers were assigned to each proposal. NIH and NSF peer review committees typically focus on one subfield and review on the order of twenty or so proposals. The number of reviewers per proposal–three to six–in our pilot was consistent with the number of reviewers typically assigned to a proposal by NIH and NSF. Peer review committees are typically larger, ranging from six to twenty people, depending on the agency and the field.
- Proposals: The FRO proposals plus supplementary information were only two to four pages long, which is significantly shorter than the 12 to 15 page proposals that researchers submit for NIH and NSF grants. Proposal authors were asked to generally describe their research concept, but were not explicitly required to describe the details of the research methodology they would use or any preliminary research. Some proposal authors volunteered more information on this for the supplementary information, but not all authors did.
- Grant Size: For the FRO proposals, reviewers were asked to assume that funded proposals would receive $50 million over five years, which is one to two orders of magnitude more funding than typical NIH and NSF proposals.
Appendix B: Feedback on Study-Specific Implementation
In addition to feedback about the review framework, we received feedback on how we implemented our pilot study, specifically the instructions and materials for the review process and the submission platforms. This feedback isn’t central to this paper’s investigation of expected value forecasting, but we wanted to include it in the appendix for transparency.
Reviewers were sent instructions over email that outlined the review process and linked to Metaculus’ webpage for this pilot. On Metaculus’ website, reviewers could find links to the proposals on FAS’ website and the supplementary information in Google docs. Reviewers were expected to read those first and then read through the resolution criteria for each forecasting question before submitting their answers on Metaculus’ platform. Reviewers were asked to submit the explanations behind their forecasts in a separate Google form.
Some reviewers had no problem navigating the review process and found Metaculus’ website easy to use. However, feedback from other reviewers suggested that the different components necessary for the review were spread out over too many different websites, making it difficult for reviewers to keep track of where to find everything they needed.
Some had trouble locating the different materials and pieces of information needed to conduct the review on Metaculus’ website. Others found it confusing to have to submit their forecasts and explanations in two separate places. One reviewer suggested that the explanation of the impact scoring system should have been included within the instructions sent over email rather than in the resolution criteria on Metaculus’ website so that they could have read it before reading the proposal. Another reviewer suggested that it would have been simpler to submit their forecasts through the same Google form that they used to submit their explanations rather than through Metaculus’ website.
Based on this feedback, we would recommend that future implementations streamline their submission process to a single platform and provide a more extensive set of instructions rather than seeding information across different steps of the review process. Training sessions, which science funding agencies typically conduct, would be a good supplement to written instructions.
Appendix C: Total Expected Utility Calculations
To calculate the total expected utility, we first converted all of the impact scores into utility by taking two to the exponential of the impact score, since the impact scoring system is base 2 exponential:
Utility=2Impact Score.
We then were able to average the utilities for each milestone and conduct additional calculations.
To calculate the total utility of each milestone, ui, we averaged the social utility and the scientific utility of the milestone:
ui = (Social Utility + Scientific Utility)/2.
The total expected utility (TEU) of a proposal with two milestones can be calculated according to the general equation:
TEU = u1P(m1 ∩ not m2) + u2P(m2 ∩ not m1) + (u1+u2)P(m1m2),
where P(mi) represents the probability of success of milestone i and
P(m1 ∩ not m2) = P(m1) – P(m1 ∩ m2)
P(m2 ∩ not m1) = P(m2) – P(m1 ∩ m2).
For sequential milestones, milestone 2 is defined as inclusive of milestone 1 and wholly dependent on the success of milestone 1, so this means that
u2, seq = u1+u2
P(m2) = Pseq(m1 ∩ m2)
P(m2 ∩ not m1) = 0.
Thus, the total expected utility of sequential milestones can be simplified as
TEU = u1P(m1)-u1P(m2) + (u2, seq)P(m2)
TEU = u1P(m1) + (u2, seq-u1)P(m2)
This can be generalized to
TEUseq = Σi(ui, seq-ui-1, seq)P(mi).
Otherwise, the total expected utility can be simplified to
TEU = u1P(m1) + u2P(m2) – (u1+u2)P(m1 ∩ m2).
For independent outcomes, we assume
Pind(m1 ∩ m2) = P(m1)P(m2),
so
TEUind = u1P(m1) + u2P(m2) – (u1+u2)P(m1)P(m2).
To present the results in Tables 1 and 2, we converted all of the utility values back into the impact score scale by taking the log base 2 of the results.
As Congress considers broader packages to advance critical minerals production and supply chain resilience, science diplomacy vehicles must be part of that conversation, not as an afterthought, but as an intentional and foundational pillar of any strategy.
“Structured partnerships with our allies on critical minerals innovation can ensure that the best science and the best talent are working together towards shared security and economic prosperity.”
This is a bipartisan, commonsense measure to reauthorize the Technology Modernization Fund (TMF) before it expires in September 2026.
Many states are introducing AI policies and task forces, but lack the “AI-native” personnel to build and maintain initiatives. To address this in the short term, states should establish AI Resilience Cohorts to embed early-career technologists in key offices to support state AI initiatives. Right now, Virginia and New Jersey have the opportunity to take […]