FAS Launches the 2026 INRIX x MetroLab Challenge to Foster Data-Driven Mobility Solutions
Washington, D.C. – January 13, 2026 — INRIX, a leader in transportation analytics and the Federation of American Scientists (FAS), one of the oldest science think tanks in the U.S., today announced the launch of the 2026 INRIX x MetroLab Challenge to enable data-driven transportation innovation.Announced at the National Academies’ annual Transportation Research Board meeting, the partnership supports cutting-edge research that advances positive, human-centered outcomes in cities. This will be the third iteration of the challenge.
The 2026 Challenge officially opens today, Tuesday, January 13, and will accept applications from universities across the country through March 3, 2026. The program invites teams of researchers and local government collaborators to propose innovative projects addressing real-world transportation, safety, equity, and resilience challenges using mobility data.
At least five selected teams will participate in the public-private partnership and receive free access to a suite of INRIX APIs for up to one year, enabling applied research with direct relevance to communities and policymakers.
“Over the past two years, our partnership with MetroLab has demonstrated the value of working directly with universities and local governments to address complex transportation challenges,” said Ahmed Darrat, Chief Product Officer at INRIX. “By providing researchers with access to real-world mobility data, we have seen how academic insight can be translated into practical solutions that help cities improve safety, resilience, and quality of life.”
Last year’s selected projects investigated improvements to AI-driven traffic models, road safety, and access to healthcare, among other benefits.
“Collaboration is essential to translating research into meaningful impact for cities,” said Kate Garman Burns, FAS Director for State and Local Innovation. “We are excited to once again partner with INRIX to give researchers and local governments access to powerful mobility data and to support projects that put people, safety, and equity at the center of community innovation.”
Highlights from the 2025 INRIX x MetroLab Challenge
During the 2025 Challenge, finalist teams used INRIX data to explore a wide range of pressing urban issues, including:
- Validating and enhancing AI-driven traffic models for New York City through the fusion of INRIX data and more than 500 traffic cameras
- Evaluating the impact of automated speed cameras on driver behavior and roadway safety ahead of a statewide pilot program
- Identifying environmental contributors to crash hotspots to better protect cyclists, pedestrians, and other vulnerable road users
- Examining vehicle abandonment patterns during wildfire evacuations to inform emergency response planning
- Analyzing driver behavior under congestion pricing using origin-destination trip data
- Improving disaster evacuation planning by predicting sudden traffic surges and adjusting transit services in real time
- Assessing how tornado warnings influence driving behavior and traffic flow to support emergency planning
- Designing patient-centered rural transportation services to improve healthcare access
- Identifying the most dangerous roadways by combining traffic volume data with fatal crash records to quantify risk disparities
Complete information on eligibility, the application process, available datasets, and example research questions is available at fas.org/initiative/inrix.
Researchers and local government partners are encouraged to share the Challenge broadly and submit applications over the next seven weeks. For questions, contact metrolab@fas.org.
###
ABOUT INRIX
Founded in 2004, INRIX pioneered the practice of managing traffic by analyzing data not just from road sensors, but also from vehicles. This breakthrough approach enabled INRIX to become one of the leading providers of data and insight into how people move around the world. More information at inrix.com.
ABOUT FAS
The Federation of American Scientists (FAS) works to advance progress on a broad suite of contemporary issues where science, technology, and innovation policy can deliver transformative impact, and seeks to ensure that scientific and technical expertise have a seat at the policymaking table. Established in 1945 by scientists in response to the atomic bomb, FAS continues to bring scientific rigor and analysis to address national challenges. More information about FAS work at fas.org.
In Remembrance of Dearly Departed Federal Datasets
On this All Hallow’s Eve, let us recognize the losses of datasets that served the American people
There’s been lots of talk – and some numbers (often in the thousands) – about disappearing federal datasets, especially after many went dark last January when agencies rushed to scrub the perceived spectre of data on gender, DEI, and climate from the public record. Most of those datasets have returned from the dead, some permanently changed by the experience.
Though it’s premature to breathe a sigh of relief – the future of federal data remains in jeopardy – we thought Halloween was an opportune time to ask, which federal datasets have left this mortal realm?
Here’s what we found.
The good news
For the most part, the vast majority of the hundreds of thousands of datasets produced by the federal government are still alive, and have so far escaped mutilation1 or termination. By our rough counts, the datasets that have been truly axed number perhaps in the dozens (not hundreds or thousands).
The bad news
All federal datasets are currently at risk of death by a thousand cuts, weakened by the loss of staff and expertise, contracts, and scientific advisory committees. Just because a given dataset hasn’t been explicitly killed off, doesn’t mean that an agency still has the capacity to collect, protect, process, and publish that data. Also, datasets and variables that do not align with Administration priorities, or might reflect poorly on Administration policy impacts, seem to be especially in the cross-hairs.
The details
We’ve identified three types of data decedents. Examples are below, but visit the Dearly Departed Dataset Graveyard at EssentialData.US for a more complete tally and relevant links.
- Terminated datasets. These are data that used to be collected and published on a regular basis (for example, every year) and will no longer be collected. When an agency terminates a collection, historical data are usually still available on federal websites. This includes the well-publicized terminations of USDA’s Current Population Survey Food Security Supplement, and EPA’s Greenhouse Gas Reporting Program, as well as the less-publicized demise of SAMHSA’s Drug Abuse Warning Network (DAWN). Meanwhile, the Community Resilience Estimates Equity Supplement that identified neighborhoods most socially vulnerable to disasters has both been terminated and pulled from the Census Bureau’s website.
- Removed variables. With some datasets, agencies have taken out specific data columns, generally to remove variables not aligned with Administration priorities. That includes Race/Ethnicity (OPM’s Fedscope data on the federal workforce) and Gender Identity (DOJ’s National Crime Victimization Survey, the Bureau of Prison’s Inmate Statistics, and many more datasets across agencies).
- Discontinued tools. Digital tools can help a broader audience of Americans make use of federal datasets. Departed tools include EPA’s Environmental Justice Screening and Mapping tool – known to friends as “EJ Screen” – which shined a light on communities overburdened by environmental harms, and also Homeland Infrastructure Foundation-Level Data (HIFLD) Open, a digital go-bag of ~300 critical infrastructure datasets from across federal agencies relied on by emergency managers around the country.
Forever in our hearts, and in some cases, given a second life
Another pattern we saw is that some tools have been reincarnated in civil society. Climate Central breathed life back into the U.S. Billion-Dollar Weather and Climate Disasters database, Public Environmental Data Partners did the same for EJScreen, and Fulton Ring brought back FEMA’s Future Risk Index. All of these tools still depend on the federal data underlying them. Beware, without fresh data to feed on, these tools will turn into the walking dead.
Lurking in the shadows
While our focus now is on deceased federal datasets, other threats loom heavy on the horizon. For example, there are a growing number of examples where the primary federal data remain, but the Administration’s interpretation of that data has veered away from science and toward politics (cases in point: Department of Energy’s July report on the impacts of greenhouse gas emissions on the climate or the CDC’s September guidance on COVID vaccines for children). The data systems aren’t dead, but the implications certainly are scary.
We invite you to take a moment to click through the graveyard of the federal datasets, variables, and tools mentioned above, and more, at the Dearly Departed Dataset Graveyard at EssentialData.US. And if we missed a dataset, please let us know.
Happy Halloween 🎃
Huge thanks to colleagues in the Federation of American Scientists and EssentialData.US, The Impact Project, and Public Environmental Data Partners for the collaboration on this project, and for all who submitted obituaries of their dearly departed datasets.
This analysis includes data, variables, and tools that have been terminated or removed before their time. It represents an attempt to capture substantive data losses and changes above baseline. For example, most data collections for evaluation purposes are not intended to go on indefinitely, and their termination is not included. Additionally, administrations often stand up websites and interactive tools to advance specific policies. We are not cataloging the breadth of such tools that disappeared.
CORRECTION: An earlier version of this post described the “System Name” column in the Federal AI Use Case Inventory as missing. In fact, the dataset had been restructured, but still retained that column. We’ll scratch that one off our list of datasets to light a candle for 
The Data We Take for Granted: Telling the Story of How Federal Data Benefits American Lives and Livelihoods
Across the nation, researchers, data scientists, policy analysts and other data nerds are anxiously monitoring the demise of their favorite federal datasets. Meanwhile, more casual users of federal data continue to analyze the deck chairs on the federal Titanic, unaware of the coming iceberg as federal cuts to staffing, contracting, advisory committees, and funding rip a giant hole in our nation’s heretofore unsinkable data apparatus. Many data users took note when the datasets they depend on went dark during the great January 31 purge of data to “defend women,” but then went on with their business after most of the data came back in the following weeks.
Frankly, most of the American public doesn’t care about this data drama.
However, like many things in life, we’ve been taking our data for granted and will miss it terribly when it’s gone.
As the former U.S. Chief Data Scientist, I know first-hand how valuable and vulnerable our nation’s federal data assets are. However, it took one of the deadliest natural disasters in U.S history to expand my perspective from that of just a data user, to a data advocate for life.
Twenty years ago this August, Hurricane Katrina made landfall in New Orleans. The failure of the federal flood-protection infrastructure flooded 80% of the city resulting in devastating loss of life and property. As a data scientist working in New Orleans at the time, I’ll also note that Katrina rendered all of the federal data about the region instantly historical.
Our world had been turned upside down. Previous ways of making decisions were no longer relevant, and we were flying blind without any data to inform our long-term recovery. Public health officials needed to know where residents were returning to establish clinics for tetanus shots. Businesses needed to know the best locations to reopen. City Hall needed to know where families were returning to prioritize which parks they should rehabilitate first.
Normally, federal data, particularly from the Census Bureau, would answer these basic questions about population, but I quickly learned that the federal statistical system isn’t designed for rapid, localized changes like those New Orleans was experiencing.
We explored proxies for repopulation: Night lights data from NASA, traffic patterns from the local regional planning commission, and even water and electricity hookups from utilities. It turned out that our most effective proxy came from an unexpected source: a direct mail marketing company. In other words, we decided to use junk mail data to track repopulation.
Access to direct mail company Valassis’ monthly data updates was transformative, like switching on a light in a dark room. Spring Break volunteers, previously surveying neighborhoods to identify which houses were occupied or not, could now focus on repairing damaged homes. Nonprofits used evidence of returning residents to secure grants for childcare centers and playgrounds.
Even the police chief utilized this “junk mail” data. The city’s crime rates were artificially inflated because they used a denominator of annual Census population estimates that couldn’t keep pace with the rapid repopulation. Displaced residents had been afraid to return because of the sky-high crime rates, and the junk mail denominator offered a more timely, accurate picture.
I had two big realizations during this tumultuous period:
- Though we might be able to Macgyver some data to fill the immediate need, there are some datasets that only the federal government can produce, and
- I needed to expand my worldview from being just a data user, to also being an advocate for the high quality, timely, detailed data we need to run a modern society.
Today, we face similar periods of extreme change. Socio-technological shifts from AI are reshaping the workforce; climate-fueled disasters are coming at a rapid pace; and federal policies and programs are undergoing massive shifts. All of these changes will impact American communities in different ways. We’ll need data to understand what’s working, what’s not, and what we do next.
For those of us who rely on federal data in small or large ways, it’s time to champion the federal data we often take for granted. And, it’s also going to be critical that we, as active participants in this democracy, take a close look at the downstream consequences of weakening or removing any federal data collections.
There are upwards of 300,000 federal datasets. Here are just three that demonstrate their value:
- Bureau of Justice Statistics’ National Crime Victimization Survey (NCVS): The NCVS is a sample survey produced through a collaboration between the Department of Justice and the Census Bureau that asks people if they’ve been victims of crime. It’s essential because it reveals the degree to which different types of crimes are underreported. Knowing the degree to which crimes like intimate partner violence, sexual assault, and hate crimes tend to be under-reported helps law enforcement agencies better interpret their own crime data and protect some of their most vulnerable constituents.
- NOAA’s ARGO fleet of drifting buoys: Innovators in the autonomous shipping industry depend on NOAA data such as that collected by the Argo Fleet of drifting buoys – an international collaboration that measures global ocean conditions. These detailed data train AI algorithms to find the safest and most fuel-efficient ocean routes.
- USGS’ North American Bat Monitoring Program: Bats save the American agricultural industry billions of dollars annually by consuming insects that damage crops. Protecting this essential service requires knowing where bats are. The USGS North American Bat Monitoring Program database is an essential resource for developers of projects that could disturb bat populations – projects such as highways, wind farms, and mining operations. This federal data not only protects bats but also helps streamline permitting and environmental impact assessments for developers.
If your work relies on federal data like these examples, it’s time to expand your role from a data user to a data advocate. Be explicit about the profound value this data brings to your business, your clients, and ultimately, to American lives and livelihoods.
That’s why I’m devoting my time as a Senior Fellow at FAS to building EssentialData.US to collect and share the stories of how specific federal datasets can benefit everyday Americans, the economy, and America’s global competitiveness.
EssentialData.US is different from a typical data use case repository. The focus is not on the user – researchers, data analysts, policymakers, and the like. The focus is on who ultimately benefits from the data, such as farmers, teachers, police chiefs, and entrepreneurs.
A good example is the Department of Transportation’s T-100 Domestic Segment Data on airplane passenger traffic. Analysts in rural economic development offices use these data to make the case for airlines to expand to their market, or for state or federal investment to increase an airport’s capacity. But it’s not the data analysts who benefit from the T-100 data. The people who benefit are the cancer patient living in a rural county who can now fly directly from his local airport to a metropolitan cancer center for lifesaving treatment, or the college student who can make it back to her home town for her grandmother’s 80th birthday without missing class.
Federal data may be largely invisible, but it powers so many products and services we depend on as Americans, starting with the weather forecast when we get up in the morning. The best way to ensure that these essential data keep flowing is to tell the story of their value to the American people and economy. Share the story of your favorite dataset with us at EssentialData.US. Here’s a direct link to the form.
Kickstarting Collaborative, AI-Ready Datasets in the Life Sciences with Government-funded Projects
In the age of Artificial Intelligence (AI), large high-quality datasets are needed to move the field of life science forward. However, the research community lacks strategies to incentivize collaboration on high-quality data acquisition and sharing. The government should fund collaborative roadmapping, certification, collection, and sharing of large, high-quality datasets in life science. In such a system, nonprofit research organizations engage scientific communities to identify key types of data that would be valuable for building predictive models, and define quality control (QC) and open science standards for collection of that data. Projects are designed to develop automated methods for data collection, certify data providers, and facilitate data collection in consultation with researchers throughout various scientific communities. Hosting of the resulting open data is subsidized as well as protected by security measures. This system would provide crucial incentives for the life science community to identify and amass large, high-quality open datasets that will immensely benefit researchers.
Challenge and Opportunity
Life science has left the era of “one scientist, one problem.” It is becoming a field wherein collaboration on large-scale research initiatives is required to make meaningful scientific progress. A salient example is Alphafold2, a machine learning (ML) model that was the first to predict how a protein will fold with an accuracy meeting or exceeding experimental methods. Alphafold2 was trained on the Protein Data Bank (PDB), a public data repository containing standardized and highly curated results of >200,000 experiments collected over 50 years by thousands of researchers.
Though such a sustained effort is laudable, science need not wait another 50 years for the ‘next PDB’. If approached strategically and collaboratively, the data necessary to train ML models can be acquired more quickly, cheaply, and reproducibly than efforts like the PDB through careful problem specification and deliberate management. First, by leveraging organizations that are deeply connected with relevant experts, unified projects taking this approach can account for the needs of both the people producing the data and those consuming it. Second, by centralizing plans and accountability for data and metadata standards, these projects can enable rigorous and scalable multi-site data collection. Finally, by securely hosting the resulting open data, the projects can evaluate biosecurity risk and provide protected access to key scientific data and resources that might otherwise be siloed in industry. This approach is complementary to efforts that collate existing data, such as the Human Cell Atlas and UCSD Genome Browser, and satisfy the need for new data collection that adheres to QC and metadata standards.
In the past, mid-sized grants have allowed multi-investigator scientific centers like the recently funded Science and Technology Center for Quantitative Cell Biology (QCB, $30M in funding 2023) to explore many areas in a given field. Here, we outline how the government can expand upon such schemes to catalyze the creation of impactful open life science data. In the proposed system, supported projects would allow well-positioned nonprofit organizations to facilitate distributed, multidisciplinary collaborations that are necessary for assembling large, AI-ready datasets. This model would align research incentives and enable life science to create the ‘next PDBs’ faster and more cheaply than before.
Plan of Action
Existing initiatives have developed processes for creating open science data and successfully engaged the scientific community to identify targets for the ‘next PDB’ (e.g., Chan Zuckerberg Initiative’s Open Science program, Align’s Open Datasets Initiative). The process generally occurs in five steps:
- A multidisciplinary set of scientific leaders identify target datasets, assessing the scale of data required and the potential for standardization, and defining standards for data collection methods and corresponding QC metrics.
- Collaboratively develop and certify methods for data acquisition to de-risk the cost-per-datapoint and utility of the data.
- Data collection methods are onboarded at automation partner organizations, such as NSF BioFoundries and existing National Labs, and these automation partners are certified to meet the defined data collection standards and QC metrics.
- Scientists throughout the community, including those at universities and for-profit companies, can request data acquisition, which is coordinated, subsidized, and analyzed for quality.
- Data becomes publicly available and is hosted in a stable, robustly maintained database with biosecurity, cybersecurity, and privacy measures in perpetuity for researchers to access.
The U.S. Government should adapt this process for collaborative, AI-ready data collection in the life sciences by implementing the following recommendations:
Recommendation 1. An ARPA-like agency — or agency division — should launch a Collaborative, AI-Ready Datasets program to fund large-scale dataset identification and collection.
This program should be designed to award two types of grants:
- A medium-sized “phase 1” award of $1-$5m to fund new dataset identification and certification. To date, roadmapping dataset concepts (Steps 1-2 above) has been accomplished by small-scale projects of $1-$5M with a community-driven approach. Though selectively successful, these projects have not been as comprehensive or inclusive as they could otherwise be. Government funding could more sustainably and systematically permit iterative roadmapping and certification in areas of strategic importance.
- A large “phase 2” award of $10-$50m to fund the collection of previously identified datasets. Currently, there are no funding mechanisms designed to scale up acquisition (Steps #3-4 above) for dataset concepts that have been deemed valuable and derisked. To fill this gap, the government should leverage existing expertise and collaboration across the nonprofit research ecosystem by awarding grants of $10-50m for the coordination, acquisition, and release of mature dataset concepts. The Human Genome project is a good analogy, wherein a dataset concept was identified and collection was distributed amongst several facilities.
Recommendation 2. The Office of Management and Budget should direct the NSF and NIH to develop plans for funding academics and for-profits traunched on data deposition.
Once an open dataset is established, the government can advance the use and further development of that dataset by providing grants to academics that are traunched on data deposition. This approach would be in direct alignment with the government’s goals for supporting open, shared resources for AI innovation as laid out in section 5.2 of the Executive Order on the Safe, Secure, and Trustworthy Development and Use of Artificial Intelligence.
Agencies’ approaches to meeting this priority could vary. In one scenario, a policy or program could be established in which grantees would use a portion of the funds disbursed to them to pay for open data acquisition at a certified data provider. Analogous structures have enabled scientists to access other types of shared scientific infrastructure, such as the NSF’s ACCESS program. In the same way that ACCESS offers academics access to compute resources, it could be expanded to offer academic access to data acquisition resources at verified facilities. Offering grants in this way would incentivize the scientific community to interact with and expand upon open datasets, as well as encourage compliance through traunching.
Efforts to support use and development of open, certified datasets could also be incorporated into existing programs, including the National AI Research Resource, for which complementary programs could be developed to provide funding for standardized data acquisition and deposition. Similar ideas could also be incorporated into core programs within NSF and NIH, which already disburse funds after completion of annual progress reports. Such programs could mandate checks for data deposition in these reports.
Conclusion
Collaborative, AI-Ready datasets would catalyze progress in many areas of life science, but realizing them requires innovative government funding. By supporting coordinated projects that span dataset roadmapping, methods and standards development, partner certification, distributed collection, and secure release on a large scale, the government can coalesce stakeholders and deliver the next generation of powerful predictive models. To do so, it should combine small-sized, mid-sized, and traunched grants in unified initiatives that are orchestrated by nonprofit research organizations, which are uniquely positioned to execute these initiatives end-to-end. These initiatives should balance intellectual property protection and data availability, and thereby help deliver key datasets upon which new scientific insights depend.
This action-ready policy memo is part of Day One 2025 — our effort to bring forward bold policy ideas, grounded in science and evidence, that can tackle the country’s biggest challenges and bring us closer to the prosperous, equitable and safe future that we all hope for whoever takes office in 2025 and beyond.
PLEASE NOTE (February 2025): Since publication several government websites have been taken offline. We apologize for any broken links to once accessible public data.
Roadmapping dataset opportunities, which can take up to a year, requires convening experts across multiple disciplines, including experimental biology, automation, machine learning, and others. In collaboration, these experts assess both the feasibility and impact of opportunities, as well as necessary QC standards. Roadmapping culminates in determination of dataset value — whether it can be used to train meaningful new machine learning models.
To mitigate single-facility risk and promote site-to-site interoperability, data should be collected across multiple sites. To ensure that standards and organization holds across sites, planning and documentation should be centralized.
Automation partners will be evaluated according to the following criteria:
- Commitment to open science
- Rigor and consistency in methods and QC procedures
- Standardization of data and metadata ontologies
More specifically, certification will depend upon the abilities of partners to accommodate standardized ontologies, capture sufficient metadata, and reliably pass data QC checks. It will also require partners to have demonstrated a commitment to data reusability and replicability, and that they are willing to share methods and data in the open science ecosystem.
Today, scientists have no obligation to publish every piece of data they collect. In an Open Data paradigm, all data must eventually be shared. For some types of data, a short, optional embargo period would enable scientists to participate in open data efforts without compromising their ability to file patents or publish papers. For example, in protein engineering, the patentable product is the sequence of a designed protein, making immediate release of data untenable. An embargo period of one to two years is sufficient to alleviate this concern and may even hasten data sharing by linking it to a fixed length of time after collection, rather than to publication. Whether or not an embargo should be implemented and its length should be determined for each data type, and designed to encourage researchers to participate in acquisition of open data.
Biological data is a strategic resource and requires stewardship and curation to ensure it has maximum impact. Thus, data that is generated through the proposed system should be hosted by high-quality providers that adhere to biosecurity standards and enforce embargo periods. Appropriate biosecurity standards will be specific to different types of data, and should be formulated and periodically reevaluated by a multidisciplinary group of stakeholders. When access to certified, post-embargo data is requested, the same standards will apply as will export controls. In some instances, for some users, restricting access may be reasonable. For offering this suite of valuable services, hosting providers should be subsidized through reimbursements.
Establish Data Standards To Protect Newborn DNA Privacy by Developing Data Storage Standards for Newborn Screening Samples
Newborn screening is performed on millions of babies in the U.S. every year to test for rare genetic diseases and, when necessary, allow for early treatment. While newborn screening is mandated by the federal government, each state runs its own screening program. Importantly, individual states manage how newborn screening data is stored and, potentially, accessed and used in the future. While such data is often used for quality assurance testing and clinical research, there have been instances of law enforcement subpoenaing newborn screening data for use in criminal investigations. For example, New Jersey used newborn screening data to investigate a decades-old sexual assault This raises major concerns about overall transparency of data use and privacy in the newborn screening process.
The incoming administration should encourage states to develop data handling standards for newborn screening data. Specifically these standards should include how long data is stored and who can access it. This can be accomplished by directing the Health and Human Services’ (HHS) Federal Advisory Committee on Heritable Disorders in Newborns and Children (ACHDNC) to provide recommendations that clearly communicate data use and privacy measures to state health departments. In addition, the incoming administration should also encourage development of increased educational materials for parents to explain these privacy concerns, and create funding opportunities to incentivize both of these measures.
Challenge and Opportunity
Newborn screening is a universal practice across the United States. Blood samples are taken from infants only a few days old to test for a variety of genetic diseases such as phenylketonuria, which can cause intellectual disability that can be prevented through changes in diet—if it is caught early enough. These blood samples can be used for both metabolic and genetic tests, depending on which disease is being tested for and how it is detected. Phenylketonuria, for example, is detected by high levels of a molecule called phenylalanine in the blood, while spinal muscular atrophy (SMA) is detected by changes in the genetic sequence of the gene associated with SMA. Newborn screening is an essential practice that identifies a wide range of severe diseases before symptoms occur, and three babies out of every 1,000 are identified with a genetic condition.
While newborn screening is required by the federal government, each state can determine which panel of diseases are tested. The Department of Health and Human Services established an Advisory Committee on Heritable Disorders in Newborns and Children (ACHDNC), which regularly updates a Recommended Uniform Screening Panel (RUSP) with conditions. For example, SMA was approved to the RUSP in 2018, and all 50 states have now added SMA to their screening panels. Much of the effort to both nominate conditions to the federal RUSP and to encourage individual states to adapt spinal muscular atrophy testing was led by patient advocacy groups such as CureSMA, and these sorts of groups play a significant role in the addition of future conditions. Similar efforts are underway for Krabbe disease, which was added to the RUSP in 2024 and is currently screened for in only twelve states, a number that may increase in the coming years as more states consider adding it to their panels. State advisory boards will review new disease nominations and, along with their status on the RUSP, will often consider how prevalent a disease is, if there are treatments available for the disease, and cost-effectiveness of screening for this condition. Regardless of which tests are performed, every state participates in newborn screening. Importantly, newborn screening does not require affirmative consent from parents—some states offer opt-out options, generally for religious reasons, but 98% of infants are screened.
Mandatory newborn screening programs have led health departments across the country to obtain genetic data from nearly every child in the country for decades. With recent developments in genetic sequencing technologies, this means that, theoretically, this newborn screening data could be repurposed for other functions. In 2022, the New Jersey Office of the Public Defender filed a lawsuit against the New Jersey Department of Health for complying with a subpoena to provide newborn screening data to the police as part of a sexual assault investigation. Specifically, law enforcement subpoenaed the blood sample of a suspect’s child, which they used to perform new DNA analysis to match DNA crime scene evidence. The lawsuit reveals that the New Jersey Department of Health has retained newborn screening blood spots for over twenty years; that the data obtained from the subpoena was used to bring criminal charges for a crime committed in 1996; and that the Office of the Public Defender were not provided information about how many similar subpoenas have been complied with in the past.
This case highlights the bigger issue of newborn screening data as the United States’ “hidden national DNA database.” Law enforcement has potential access to decades of samples that can be used for genetic analysis that were not intended for law enforcement use. Police in other states like California have also sought access to newborn screening databases for investigational purposes. In California, the state health department keeps samples indefinitely, and not only is this information not disclosed to parents, it no longer provides parents with an opt-out option. As law enforcement agencies across states begin to understand the magnitude of data that can be found in these databases, it is becoming clear that health department policies for regulating access to these data are lacking.
Using genetic data in law enforcement has become increasingly common. The practice of “investigative genetic genealogy,” or IGG, has made national headlines in recent years, in which law enforcement can access genetic data from publicly available databases to use in criminal investigations. These databases are full of genetic data that consumers who participate in direct-to-consumer genetic testing, such as 23andMe, can use to voluntarily upload and share their data with more people. IGG presents its own privacy concerns, but it is important to recognize the voluntary nature of both (a) participating in direct-to-consumer testing and (b) uploading it to a third-party website. Newborn screening, on the other hand, is not an optional practice.
Proponents of IGG argue that using genetic data is very effective at not only catching killers—and doing so quicker than without DNA data—but also exonerating innocents. However, this fact does not outweigh the major issues of privacy, transparency, and the fact that this approach potentially violates the fourth amendment’s protections against unreasonable search and seizures—especially when it comes to incorporating newborn screening data into these approaches. A previous court case found a hospital in violation of the fourth amendment for providing law enforcement with warrantless drug screening results from pregnant women, even though the women were under the impression they were receiving diagnostic tests. The Supreme Court argued that the hospital’s actions break down public trust in the health system, as patients have a “reasonable expectation of privacy” regarding their test results. While cases of subpoenaing newborn screening data may not currently violate any legal procedure, allowing law enforcement access to these data for use in future investigations, particularly without informing the individuals or parents involved, may also erode trust in the health system. This may lead to parents—when given the option—to opting out of newborn screening programs more often, leading to an increase in genetic and metabolic disorders going undiagnosed in newborns and causing major health problems in the future. In addition, with many scientists advocating for adopting whole-genome sequencing of newborns—instead of simply sequencing a panel of genes that are commonly identified as disease-causing in newborns—the amount of potential available genetic data could be staggering. As a result, the incoming administration needs to take action to address the lack of transparent policies regarding newborn screening data in order to maintain its success as a public health measure.
Plan of Action
Current genetic privacy legislation
The landscape of genetic privacy legislation is, currently, somewhat patchwork. At the federal level, the most relevant legislation includes (1) the Genetic Information Nondiscrimination Act (GINA), (2) the Affordable Care Act (ACA), and (3) the Health Insurance Portability and Accountability Act (HIPAA). GINA specifically prohibits genetic discrimination in health insurance and in the workplace. This means that health insurers cannot deny coverage based on genetic data, and employers cannot make hiring, firing, or promotion decisions based on genetic data. The ACA strengthens GINA’s stipulation against genetic discrimination in health insurance by mandating that any health insurance issuer must provide coverage to whomever applies, as well as including genetic information on the list of factors that cannot be considered when determining overage or premium costs. HIPAA additionally regulates genetic data gathered in a healthcare setting, which includes newborn screening data, but HIPAA-protected information can be shared at the request of a court order or subpoena. The FBI developed an interim policy regarding all types of forensic genetic genealogy—often used with direct-to-consumer genetic tests but could also be applicable to newborn screening—which states the criteria required for investigators to use this approach. Criteria includes the requirement that a case must be an unsolved violent crime. In addition, the interim policy states that investigative agencies must identify themselves as law enforcement—a previous case was solved by accessing genetic databases without disclosing this information to the database—and that any collected data must be destroyed upon conclusion of the case.
Additionally, many states have additional laws that strengthen genetic privacy regulation on top of federal regulations. Maryland passed a bill that regulates the use of genetic data in criminal investigations—specifically, it requires that law enforcement obtains informed consent from non-suspects before using their DNA in investigations. Other recent state regulations that address law enforcement access to genetic data in one way or another include Montana, which requires government agencies to obtain a warrant to access genetic data, and Tennessee, which explicitly allows law enforcement to access genetic data as long as they obtain a warrant or subpoena. Importantly, many of these laws are geared more towards addressing genetic data from direct-to-consumer testing and do not directly apply to newborn screening. Like federal legislation, state genetic privacy legislation is largely lacking in policies to address the use of newborn screening by law enforcement.
On top of legislation regarding genetic privacy, states all have their own respective policies regarding newborn screening that vary dramatically. For example, a court in Minnesota found that nonconsensual storage of newborn screening data for use outside of genetic screening purposes violates the state genetic privacy law stating that genetic information can only be distributed with an individual’s written consent, leading to Minnesota destroying its newborn screening samples. Other states have no legislation at all. Additionally, states can have laws addressing other, non-law enforcement uses of newborn screening data; another major use of newborn screening data is research.
Policy Recommendations
The incoming administration should address the lack of transparency in newborn screening data management by implementing the following recommendations:
Direct the ACHDNC to develop national recommendations detailing standards for newborn genetic screening sample and data handling.
These standards should include:
Standards for what the data can be used for outside of newborn screening, and by whom. Newborn screening data is used in additional ways outside of law enforcement; it can also be used for quality assurance to help ensure tests are working properly, to help develop new tests, and in clinical trials. There are compelling arguments for these uses; for clinical research, for example, this data can contribute towards research studying the disease the child may have been diagnosed with. However, for the sake of transparency, policy should state specifically what newborn genetic data can and cannot be used for, and who is allowed access to the data under these circumstances. For instance, Michigan has a program called the Michigan BioTrust, which takes the leftover, de-identified newborn screening samples for use in research towards understanding disease. Parents can choose to opt in or out at the time of screening, and parents—as well as children, upon turning 18—can change their mind and have their data removed later if they so choose. Regardless of state decisions on whether law enforcement should be able to access their newborn screening data, clearly stating what the data can be used for overall is paramount for parents to understand what happens to their children’s samples.
The length of time that blood samples and genetic data can be stored in state databases, and when, if ever, the data will be destroyed. As detailed by the lawsuit, New Jersey had been storing samples for over twenty years, although parents were not actually aware of this fact until the lawsuit was filed; potentially in response to this lawsuit, starting in November 2024, New Jersey will be destroying blood spots older than 2 years. Similarly, Delaware stores blood spot samples for three years before destroying them. While there is no definitive answer to what the best timeline for saving samples is, establishing a transparent timeline for how long samples can be stored in each state will improve data handling transparency.
What say, if any, do parents have in what is done with their child’s samples and data. In Texas, after a lawsuit determining that storing newborn screening samples without consent was against the law, parents have the right to request their child’s samples be destroyed if they so choose. Developing policies that allow parents—or children themselves, once they become adults—to have a say in what happens to the samples after screening is completed would provide individuals control of their data without disincentivizing testing.
Partner with state advisory boards to develop educational materials for parents detailing ACHDNC recommendations and state-specific policy.
While newborn screening is mandated, there is variable information available to parents regarding what is done with the data. For example, Michigan has an extensive Q&A page on their Department of Health website addressing many major newborn screening-related questions, including a section addressing what is done with samples after screening is complete. In contrast, West Virginia’s Q&A page does not address what happens to the samples after testing. Not only would developing standard policies for data handling be beneficial, but improving the dissemination of such information to parents would increase overall transparency and improve trust in the system. The incoming administration should work closely with state advisory boards to improve the communication of newly-developed data handling standards to parents and other relevant parties.
Incentivize development of plans by providing grant opportunities to state health departments to support newborn screening programs.
Currently, newborn screening programs receive no direct federal funding; however, costs include operating costs, testing equipment, and personnel on top of the tests themselves. In general, newborn screening is paid for through a fee for the tests, which are often covered by the parents’ health insurance, or the State Children’s Health Insurance Program or Medicaid. However, grants such as the NBS Co-Propel have been awarded to states in the past for creating improvements in their newborn screening programs such as support for long-term follow up on patients that have positive test results returned to them. The Co-Propel grant was administered through the Maternal & Child Health Bureau (MCHB) of Health and Human Services; the incoming administration could recommend that MCHB initiates a new funding opportunity for states to either develop data storage standards and/or educational materials for families to encourage the adaptation of these standards.
Conclusion
Newborn genetic screening is an essential public health measure that saves thousands of lives each year by identifying diseases in newborns that can either be prevented early or treated immediately rather than waiting until severe symptom onset. However, with the advent of new genetic technologies and the burgeoning use of newborn genetic screening data in law enforcement investigations, major privacy and transparency issues are becoming known to parents, potentially putting trust in the newborn screening process at risk. This could reduce desire to participate in these programs, leading to an inability to quickly diagnose many preventable or treatable conditions. The incoming administration should work towards encouraging state health departments to develop clear and well-communicated data storage standards for newborn screening samples in order to combat these concerns moving forward.
This action-ready policy memo is part of Day One 2025 — our effort to bring forward bold policy ideas, grounded in science and evidence, that can tackle the country’s biggest challenges and bring us closer to the prosperous, equitable and safe future that we all hope for whoever takes office in 2025 and beyond.
PLEASE NOTE (February 2025): Since publication several government websites have been taken offline. We apologize for any broken links to once accessible public data.
Newborn screening is performed by pricking a newborn’s heel to obtain a blood sample, or “blood spot,” within two days of being born. These blood spot samples are used for both metabolic tests and genetic tests. Metabolic tests measure different molecules in the blood that might signal a disease, such as high levels of an amino acid called phenylalanine, which in healthy amounts is used by our bodies to make proteins and in high amounts can cause phenylketonuria. Genetic tests are performed by sequencing a panel, or selection, of genes that are often associated with newborn screening diagnoses; often, genetic testing is performed after a positive hit on a metabolic test to both confirm and further clarify the diagnosis.
The role of the Advisory Committee on Heritable Disorders in Newborns and Children (ACHDNC) is to communicate with the Secretary of the Department of Health and Human Services regarding newborn screening policies. This not only includes managing the Recommended Uniform Screening Panel, but also providing advice on grants and research projects related to newborn screening research, assistance with developing policies for state and local health departments for newborn screening implementation, and recommendations towards reducing child mortality from the diseases screened.
The Recommended Uniform Screening Panel (RUSP) is the list of disorders recommended for newborn testing. As of July 2024, the RUSP contains 38 “core conditions,” which are conditions that states specifically test for, and 26 “secondary conditions,” which are conditions that physicians may identify incidentally while screening for core conditions. New conditions can be added, and conditions can be moved between categories if the advisory board chooses to do so. These conditions include metabolic disorders such as phenylketonuria, endocrine disorders such as thyroid disorders, hemoglobin disorders such as sickle cell anemia, and others such as cystic fibrosis.
The National Human Genome Research Institute has a searchable database that details the different state genetic privacy laws, including their legislative status and a summary of their intended purpose. These laws have many goals, including expanding protections against genetic discrimination, research subject protections, artificial intelligence, and more.
Improve Extreme Heat Monitoring by Launching Cross-Agency Temperature Network
Year after year, record-breaking air temperatures and heat waves are reported nationwide. In 2023, Death Valley, California experienced temperatures as high as 129°F — the highest recorded temperature on Earth for the month of June—and in July, Southwest states experienced prolonged heat waves where temperatures did not drop below 90°F. This is especially worrisome as the frequency, intensity, and duration of rising temperatures are projected to increase, and the leading weather-related cause of death in the United States is heat. To address this growing threat, the Environmental Protection Agency (EPA) and the National Oceanic and Atmospheric Administration (NOAA) should combine and leverage their existing resources to develop extreme-heat monitoring networks that can capture spatiotemporal trends of heat and protect communities from heat-related hazards.
Urban areas are particularly vulnerable to the effects of extreme heat due to the urban heat island (UHI) effect. However, UHIs are not uniform throughout a city, with some neighborhoods experiencing higher air temperatures than others. Further, communities with higher populations of Color and lower socioeconomic status disproportionately experience higher temperatures and are reported to have the highest increase in heat-related mortality. It is imperative for local government officials and city planners to understand who is most vulnerable to the impacts of extreme heat and how temperatures vary throughout a city to develop effective heat mitigation and response strategies. While the NOAA’s National Weather Service (NWS) stations provide hourly, standardized air measurements, their data do not capture intraurban variability.
Challenge and Opportunity
Heat has killed more than 11,000 Americans since 1979, yet an extreme heat monitoring network does not exist in the country. While NOAA NWS stations capture air temperatures at a central location within a city, they do not reveal how temperatures within a city vary. This missing information is necessary to create targeted, location-specific heat mitigation and response efforts.
Synergistic Environmental Hazards and Health Impacts
UHIs are metropolitan areas that experience higher temperatures than surrounding rural regions. The temperature differences can be attributed to many factors, including high impervious surface coverage, lack of vegetation and tree canopy, tall buildings, air pollution, and anthropogenic heat. UHIs are of significant concern as they contribute to higher daytime temperatures and reduce nighttime cooling, which in turn exacerbates heat-related deaths and illnesses in densely populated areas. Heat-related illnesses include heat exhaustion, cramps, edema, syncope, and stroke, among others. However, heat is not uniform throughout a city, and some neighborhoods experience warmer temperatures than others in part due to structural inequalities. Further, it has been found that, on average, People of Color and those living below the poverty line are disproportionately exposed to higher air temperatures and experience the highest increase in heat-related mortality. As temperatures continue to rise, it becomes more imperative for the federal government to protect vulnerable populations and communities from the impacts of extreme heat. This requires tools that can help guide heat mitigation strategies, such as the proposed interagency monitoring network.
High air temperatures and extreme heat are also associated with poor air quality. As common pavement surfacing materials, like asphalt and concrete, absorb heat and energy from the sun during the day, the warm air at the surface rises with present air pollutants. High air temperatures and sunlight are also known to help catalyze the production of air pollutants such as ozone in the atmosphere and impact the movement of air and, therefore, the movement of air pollution. As a result, during extreme heat events, individuals are exposed to increased levels of harmful pollutants. Because poor air quality and extreme heat are directly related, the EPA should expand its air quality networks, which currently only detect pollutants and their sources, to include air temperature. Projections have determined extreme heat events and poor air quality days will increase due to climate change, with compounding detriments to human health.
Furthermore, extreme heat is linked not only to poor air quality but also to wildfire smoke—and they are becoming increasingly concomitant. Projections report with very high confidence that warmer temperatures will lengthen the wildfire season and thus increase areas burned. Similar to extreme heat’s relationship with poor air quality, extreme heat and wildfire smoke have a synergistic effect in negatively impacting human health. Extreme heat and wildfire smoke can lead to cardiovascular and respiratory complications as well as dehydration and death. These climatic hazards have an even larger impact on environmental and human health when they occur together.
As the UHI effect is localized and its causes are well understood, urban cities are ideal locations to implement heat mitigation and adaptation strategies. To execute these plans equitably, it is critical to identify areas and communities that are most vulnerable and impacted by extreme heat events through an extreme heat monitoring network. The information collected from this network will also be valuable when planning strategies targeting poor air quality and wildfire smoke. The launch of an extreme heat monitoring network will have a considerable impact on protecting lives.
Urban Heat Mapping Efforts
Both NOAA and EPA have existing programs that aim to map, reduce, or monitor UHIs throughout the country. These efforts may have the capacity to also implement the proposed heat monitoring network.
Since 2017, NOAA has worked with the National Integrated Heat Health Information System (NIHHIS) and CAPA Strategies LLC to fund yearly UHI mapping campaign programs, which has been instrumental in highlighting the uneven distribution of heat throughout U.S. cities. These programs rely on community science volunteers who attach NOAA-funded sensors to their cars to collect air temperature, humidity, and time data. These campaigns, however, are currently only run during summer months, and not all major cities are mapped each year. NOAA’s NIHHIS has also created a Heat Vulnerability Mapping Tool, which impressively illustrates the relationship between social vulnerability and heat exposure. These maps, however, are not updated in real-time and do not display air temperature data. Another critical tool in mapping UHIs is NWS recently created HeatRisk prototype, which identifies risks of heat-related impacts in numerous parts of the country. This prototype also forecasts levels of heat concerns up to seven days into the future. However, HeatRisk does not yet provide forecasts for the entire country and uses NWS air temperature products, which do not capture intraurban variability. The EPA has a Heat Island Reduction program dedicated to working with community groups and local officials to find opportunities to mitigate UHIs and adopt projects to build heat-resilient communities. While this program aims to reduce and monitor UHIs, there are no explicit monitoring or mapping strategies in place.
While the products and services of each agency have been instrumental in mapping UHIs throughout the country and in heat communication and mitigation efforts, consistent and real-time monitoring is required to execute extreme heat response plans in a timely fashion. Merging the resources of both agencies would provide the necessary foundation to design and implement a nationwide extreme heat monitoring network.
Plan of Action
Heat mitigation strategies are often city-wide. However, there are significant differences in heat exposure between neighborhoods. To create effective heat adaptation and mitigation strategies, it is critical to understand how and where temperatures vary throughout a city. Achieving this requires a cross-agency extreme heat monitoring network between federal agencies.
The EPA and NOAA should sign a memorandum of agreement to improve air temperature monitoring nationwide. Following this, agencies should collaborate to create an extreme heat monitoring network that can capture the intraurban variability of air temperatures in major cities throughout the country.
Implementation and continued success require a number of actions from the EPA and NOAA.
- EPA should expand its Heat Island Reduction program to include monitoring urban heat. The Inflation Reduction Act (IRA) provided the agency with $41.5 billion to fund new and existing programs, with $11 billion going toward clean air efforts. Currently, their noncompetitive and competitive air grants do not address extreme heat efforts. These funds could be used to place air temperature sensors in each census tract within cities to map real-time air temperatures with high spatial resolution.
- EPA should include air temperature monitoring in their monitoring deployments. Due to air quality tracking efforts mandated by the Clean Air Act, there are existing EPA air quality monitoring sites in cities throughout the country. Heat monitoring efforts could be tested by placing temperature sensors in the same locations.
- EPA and NOAA should help determine vulnerable communities most impacted by extreme heat. Utilizing EPA’s Environmental Justice Screening and Mapping (EJScreen) Tool and NIHHIS’s Heat Vulnerability Mapping Tool, EPA and NOAA could determine where to place air temperature monitors, as the largest burden due to extreme heat tends to occur in neighborhoods with the lowest economic status.
- NOAA should develop additional air temperature sensors. NOAA’s summer UHI campaign programs highlight the agency’s ability to create sensors that capture temperature data. Given their expertise in capturing meteorological conditions, NOAA should develop national air temperature sensors that can withstand various weather conditions.
- NOAA should build data infrastructure capable of supporting real-time monitoring. Through NIHHIS, the data obtained from the monitoring network could be updated in real-time and be publicly available. This data could also merge with the current vulnerability mapping tool and HeatRisk to examine extreme heat impacts at finer spatial scales.
Successful implementation of these recommendations would result in a wealth of air temperature data, making it possible to monitor extreme heat at the neighborhood level in cities throughout the United States. These data can serve as a foundation for developing extreme heat forecasting models, which would enable governing bodies to develop and execute response plans in a timely fashion. In addition, the publicly available data from these monitoring networks will allow local, state, and tribal officials, as well as academic and non-academic researchers, to better understand the disproportionate impacts of extreme heat. This insight can support the development of targeted, location-specific mitigation and response efforts.
Conclusion
As temperatures continue to rise in the United States, so do the risks of heat-related hazards, morbidity, and mortality. This is especially true for urban cities, where the effects of extreme heat are most prevalent. A cross-agency extreme-heat monitoring network can support the development of equitable heat mitigation and disaster preparedness efforts in major cities throughout the country.
This idea of merit originated from our Extreme Heat Ideas Challenge. Scientific and technical experts across disciplines worked with FAS to develop potential solutions in various realms: infrastructure and the built environment, workforce safety and development, public health, food security and resilience, emergency planning and response, and data indices. Review ideas to combat extreme heat here.
Urban heat islands are urbanized regions experiencing higher temperatures compared to nearby rural areas. Heat waves—also known as extreme heat events—are persistent periods of unusually hot weather lasting more than two days. Research has found, however, that urban heat islands and heat waves have a synergistic relationship.
Nationwide, more than 1,300 annual deaths are estimated to be attributable to extreme heat. This number is likely an undercount, as medical records do not regularly include the impact of heat when describing the cause of death.
The Missing Data for Systemic Improvements to U.S. Public School Facilities
Peter Drucker famously said, “You can’t improve what you don’t measure.” Data on facilities helps public schools to make equitable decisions, prevent environmental health risks, ensure regular maintenance, and conduct long-term planning. Publicly available data increases transparency and accountability, resulting in more informed decision making and quality analysis. Across the U.S., public schools lack the resources to track their facilities and operations, resulting in missed opportunities to ensure equitable access to high quality learning environments. As public schools face increasing challenges to infrastructure, such as climate change, this data gap becomes more pronounced.
Why do we need data on school facilities?
School facilities affect student health and learning. The conditions of a school building directly impact the health and learning outcomes of students. The COVID-19 pandemic brought the importance of indoor air quality into the public consciousness. Many other chronic diseases are exacerbated by inadequate facilities, causing absenteeism and learning loss. From asthma to obesity to lead poisoning, the condition of the places where children spend their time impacts their health, wellbeing, and ability to learn. Better data on the physical environment helps us understand the conditions that hinder student learning.
School buildings are a source of emissions and environmental impacts. The U.S. Energy Information Administration reports that schools annually spend $8 billion on energy, and emit an estimated 72 million metric tons of carbon dioxide. While the energy use intensity of school buildings is not itself that high when compared with other sectors, there are interesting trends such as education being the largest consumer of natural gas. The public school fleet is the largest mass transit system in the U.S. As of 2023 only 1-2% of the countries estimated nearly 500,000 buses are electric.
Data provides accountability for public investment. After highways, elementary and secondary education infrastructure is the leading public capital outlay expenditure nationwide (2021 Census). Most funds to maintain school facilities come from local and state tax sources. Considering the sizable taxpayer investment, relatively little is known about the condition of these facilities. Some state governments have no school facilities staff or funding to help manage or improve school facilities. The 2021 State of Our Schools Report, the leading resource on school facilities data, uses fiscal data to highlight the issues in school facilities. This report found that there is a $85 billion annual school facilities infrastructure funding gap, meaning that, according to industry standards for both capital investment and maintenance, schools are funded $85 billion less than what is required for upkeep. Consistent with these findings, the U.S. Government Accountability Office conducted research on school building common facilities issues and found that, in 2020, 50% of districts needed to replace or update multiple essential building systems such as HVAC or plumbing.
What data do we need?
Despite the clear connections between students’ health, learning, and the condition of school buildings, there are no standardized national data sets that assist school leaders and policy makers in making informed and strategic decisions to systematically improve facilities to support health and learning.
Some examples of data points school facilities advocates want more of include:
- Long-term planning
- The number of school districts with Facilities Master Plans, or similar long-range planning tools adoption, and funding allocations
- Emergency planning and standards for declaring school closures, especially for climate-related emergencies such as extreme heat and wildfire smoke
- Facilities footprint and condition
- Landscape and scoping datasets such as total number of facilities, square footage of buildings, acres of land managed, number and type of leased facilities
- Condition reports, including dates of last construction, repairs, and maintenance compliance checks
- Prioritization of repairs, resource usage (especially energy and water), construction practices and costs, waste from construction and/or ongoing operations
- Industry standards
- Indoor environmental quality information such as the percent of classrooms meeting industry ventilation standards
- Adoption rates of climate resiliency strategies
- Board policies, greenhouse gas emissions reductions, funds dedicated to sustainability or energy staff positions, certifications and awards, and more.
Getting strategic and accessible with facilities data
Gathering this type of data represents a significant challenge for schools that are already overburdened and lack the administrative support for facilities maintenance and operations. By supporting the best available facilities research methods, facilities conditions standards, and dedicating resources to long term planning, we ensure that data collection is undertaken equitably. Some strategies that bear these challenges in mind are:
Incorporate facilities into existing data collection and increase data linkages in integrated and high quality data centers like National Center for Education Statistics. School leaders should provide key facilities metrics through the same mechanisms by which they report other education statistics. Creating data linkages allow users to make connections using existing data.
Building capacity ensures that there are staff and support systems in place to effectively gather and process school facilities data. There are more federal funds than ever before offered for building the capacity of schools to improve facilities conditions. For instance, the U.S. Department of Education recently launched the Supporting America’s School Infrastructure grant program, aimed at developing the ability of state departments of education to address facilities matters.
Research how school facilities are connected to environmental justice to better understand how resources could be most equitably distributed. Ten Strands and UndauntedK12 are piloting a framework which looks at pollution burden indicators and school adoption of environmental and climate action. We can support policies and fund research that looks at this intersection and makes these connections more transparent.
The connection between school facilities and student health and learning outcomes is clear. What we need now are the resources to effectively collect more data on school facilities that can be used by policy makers and school leaders to plan, improve learning conditions, and provide accountability to the public.
The Federation of American Scientists values diversity of thought and believes that a range of perspectives — informed by evidence — is essential for discourse on scientific and societal issues. Contributors allow us to foster a broader and more inclusive conversation. We encourage constructive discussion around the topics we care about.
It’s Time to Move Towards Movement as Medicine
For over 10 years, physical inactivity has been recognized as a global pandemic with widespread health, economic, and social impacts. Despite the wealth of research support for movement as medicine, financial and environmental barriers limit the implementation of physical activity intervention and prevention efforts. The need to translate research findings into policies that promote physical activity has never been higher, as the aging population in the U.S. and worldwide is expected to increase the prevalence of chronic medical conditions, many of which can be prevented or treated with physical activity. Action at the federal and local level is needed to promote health across the lifespan through movement.
Research Clearly Shows the Benefits of Movement for Health
Movement is one of the most important keys to health. Exercise benefits heart health and physical functioning, such as muscle strength, flexibility, and balance. But many people are unaware that physical activity is closely tied to the health conditions they fear most. Of the top five health conditions that people reported being afraid of in a recent survey conducted by the Centers for Disease Control and Prevention (CDC), the risk for four—cancer, Alzheimer’s disease, heart disease, and stroke—is increased by physical inactivity. It’s not only physical health that is impacted by movement, but also mental health and other aspects of brain health. Research shows exercise is effective in treating and preventing mental health conditions such as depression and anxiety, rates of which have skyrocketed in recent years, now impacting nearly one-third of adults in the U.S. Physical fitness also directly impacts the brain itself, for example, by boosting its ability to regenerate after injury and improving memory and cognitive functioning. The scientific evidence is clear: Movement, whether through structured exercise or general physical activity in everyday life, has a major impact on the health of individuals and as a result, on the health of societies.
Movement Is Not Just about Weight, It’s about Overall Lifelong Health
There is increasing recognition that movement is important for more than weight loss, which was the primary focus in the past. Overall health and stress relief are often cited as motivations for exercise, in addition to weight loss and physical appearance. This shift in perspective reflects the growing scientific evidence that physical activity is essential for overall physical and mental health. Research also shows that physical activity is not only an important component of physical and mental health treatment, but it can also help prevent disease, injury, and disability and lower the risk for premature death. The focus on prevention is particularly important for conditions such as Alzheimer’s disease and other types of dementia that have no known cure. A prevention mindset requires a lifespan perspective, as physical activity and other healthy lifestyle behaviors such as good nutrition earlier in life impact health later in life.
Despite the Research, Americans Are Not Moving Enough
Even with so much data linking movement to better health outcomes, the U.S. is part of what has been described as a global pandemic of physical inactivity. Results of a national survey by the CDC published in 2022 found that 25.3% of Americans reported that outside of their regular job, they had not participated in any physical activity in the previous month, such as walking, golfing, or gardening. Rates of physical inactivity were even higher in Black and Hispanic adults, at 30% and 32%, respectively. Another survey highlighted rural-urban differences in the number of Americans who meet CDC physical activity guidelines that recommend ≥ 150 minutes per week of moderate-intensity aerobic exercise and ≥ 2 days per week of muscle-strengthening exercise. Respondents in large metropolitan areas were most active, yet only 27.8% met both aerobic and muscle strengthening guidelines. Even fewer people (16.1%) in non-metropolitan areas met the guidelines.
Why are so many Americans sedentary? The COVID-19 pandemic certainly exacerbated the problem; however, data from 2010 showed similar rates of physical inactivity, suggesting long-standing patterns of sedentary behavior in the country. Some of the barriers to physical activity are internal to the individual, such as lack of time, motivation, or energy. But other barriers are societal, at both the community and federal level. At the community level, barriers include transportation, affordability, lack of available programs, and limited access to high-quality facilities. Many of these barriers disproportionately impact communities of color and people with low income, who are more likely to live in environments that limit physical activity due to factors such as accessibility of parks, sidewalks, and recreation facilities; traffic; crime; and pollution. Action at the state and federal government level could address many of these environmental barriers, as well as financial barriers that limit access to exercise facilities and programs.
Physical Inactivity Takes a Toll on the Healthcare System and the Economy
Aside from a moral responsibility to promote the health of its citizens, the government has a financial stake in promoting movement in American society. According to recent analyses, inactive lifestyles cost the U.S. economy an estimated $28 billion each year due to medical expenses and lost productivity. Physical inactivity is directly related to the non-communicable diseases that place the highest burden on the economy, such as hypertension, heart disease, and obesity. In 2016, these types of modifiable risk factors comprised 27% of total healthcare spending. These costs are mostly driven by older adults, which highlights the increasing urgency to address physical inactivity as the population ages. Physical activity is also related to healthcare costs at an individual level, with savings ranging from 9-26.6% for physically active people, even after accounting for increased costs due to longevity and injuries related to physical activity. Analysis of 2012 data from the Agency for Healthcare Research and Quality’s Medical Expenditure Panel Survey (MEPS) found that each year, people who met World Health Organization aerobic exercise guidelines, which correspond with CDC guidelines, paid on average $2,500 less in healthcare expenses related to heart disease alone compared to people who did not meet the recommended activity levels. Changes are needed at the federal, state, and local level to promote movement as medicine. If changes are not made in physical activity patterns by 2030, it is estimated that an additional $301.8 billion of direct healthcare costs will be incurred.
Government Agencies Can Play a Role in Better Promoting Physical Activity Programs
Promoting physical activity in the community requires education, resources, and removal of barriers in order for programs to have a broad reach to all citizens, including communities that are disproportionately impacted by the pandemic of physical inactivity. Integrated efforts from multiple agencies within the federal government is essential.
Past initiatives have met with varying levels of success. For example, Let’s Move!, a campaign initiated by First Lady Michelle Obama in 2010, sought to address the problem of childhood obesity by increasing physical activity and healthy eating, among other strategies. The Food and Drug Administration, Department of Agriculture, Department of Health and Human Services including the Centers for Disease Control and Prevention, and Department of Interior were among the federal agencies that collaborated with state and local government, schools, advocacy groups, community-based organizations, and private sector companies. The program helped improve the healthy food landscape, increased opportunities for children to be more physically active, and supported healthier lifestyles at the community level. However, overall rates of childhood obesity remained constant or even increased in some age brackets since the program started, and there is no evidence of an overall increase in physical activity level in children and adolescents since that time.
More recently, the U.S. Office of Disease Prevention and Health Promotion’s Healthy People 2030 campaign established data-driven national objectives to improve the health and well-being of Americans. The campaign was led by the Federal Interagency Workgroup, which includes representatives across several federal agencies including the U.S. Department of Health and Human Services, the U.S. Department of Agriculture, and the U.S. Department of Education. One of the campaign’s leading health indicators—a small subset of high-priority objectives—is increasing the number of adults who meet current minimum guidelines for aerobic physical activity and muscle-strengthening activity from 25.2% in 2020 to 29.7% by 2030. There are also movement-related objectives focused on children and adolescents as well as older adults, for example:
- Reducing the proportion of proportion of adults who do no physical activity in their free time
- Increasing the proportion of children, adolescents, and adults who do enough aerobic physical activity, muscle-strengthening activity, or both
- Increasing the proportion of child care centers where children aged 3 to 5 years do at least 60 minutes of physical activity a day
- Increasing the proportion of adolescents and adults who walk or bike to get places
- Increasing the proportion of children and adolescents who play sports
- Increasing the proportion of older adults with physical or cognitive health problems who get physical activity
- Increasing the proportion of worksites that offer an employee physical activity program
Unfortunately, there is currently no evidence of improvement in any of these objectives. All of the objectives related to physical activity with available follow-up data either show little or no detectable change, or they are getting worse.
To make progress towards the physical activity goals established by the Healthy People 2030 campaign, it will be important to identify where breakdowns in communication and implementation may have occurred, whether it be between federal agencies, between federal and local organizations, or between local organizations and citizens. Challenges brought on by the COVID-19 pandemic (e.g., less movement outside of the house for people who now work from home) will also need to be addressed, with the recognition that many of these challenges will likely persist for years to come. Critically, financial barriers should be reduced in a variety of ways, including more expansive coverage by the Centers for Medicare & Medicaid Services for exercise interventions as well as exercise for prevention. Policies that reflect a recognition of movement as medicine have the potential to improve the physical and mental health of Americans and address health inequities, all while boosting the health of the economy.
Opening Up Scientific Enterprise to Public Participation
This article was written as part of the Future of Open Science Policy project, a partnership between the Federation of American Scientists, the Center for Open Science, and the Wilson Center. This project aims to crowdsource innovative policy proposals that chart a course for the next decade of federal open science. To read the other articles in the series, and to submit a policy idea of your own, please visit the project page.
For decades, communities have had little access to scientific information despite paying for it with their tax dollars. The August 2022 Office of Science and Technology Policy (OSTP) memorandum thus catalyzed transformative change by requiring all federally funded research to be made publicly available by the end of 2025. Implementation of the memo has been supported by OSTP’s “Year of Open Science”, which is coordinating actions across the federal government to advance open access research. Access, though, is the first step to building a more responsive, equitable research ecosystem. A more recent memorandum from the Office of Management and Budget (OMB) and OSTP outlining research and development (R&D) policy priorities for fiscal year (FY) 2025 called on federal agencies to address long-standing inequities by broadening public participation in R&D. This is a critical demand signal for solutions that ensure that federally funded research delivers for the American people.
Public engagement researchers have long been documenting the importance of partnerships with key local stakeholders — such as local government and community-based organizations — in realizing the full breadth of participation with a given community. The lived experience of community members can be an invaluable asset to the scientific process, informing and even shaping research questions, data collection, and interpretation of results. Public participation can also benefit the scientific enterprise by realizing active translation and implementation of research findings, helping to return essential public benefits from the $170 billion invested in R&D each year.
The current reality is that many local governments and community-based organizations do not have the opportunities, incentives, or capacity to engage effectively in federally-funded scientific research. For example, Headwaters Economics found that a significant proportion of communities in the United States do not have the staffing, resources, or expertise to apply to receive and manage federal funding. Additionally, community-based organizations (CBOs) — the groups that are most connected to people facing problems that science could be activated to solve, such as health inequities and environmental injustices — face similar capacity barriers, especially around compliance with federal grants regulations and reporting obligations. Few research funds exist to facilitate the building and maintenance of strong relationships with CBOs and communities, or to provide capacity-building financing to ensure their full participation. Thus, relationships between communities and academia, companies, and the federal government often consume those communities’ time and resources without much return on their investment.
Great participatory science exists, if we know where to look
Place-based investments in regional innovation and research and development (R&D) unlocked by the CHIPS and Science Act (i.e. Economic Development Administration’s (EDA) Tech Hubs and National Science Foundation’s (NSF) Regional Innovation Engines and Convergence Accelerator) are starting to provide transformative opportunities to build local research capacity in an equitable manner. What they’ll need are the incentives, standards, requirements, and programmatic ideas to institutionalize equitable research partnerships.
Models of partnership have been established between community organizations, academic institutions, and/or the federal government focused on equitable relationships to generate evidence and innovations that advance community needs.
An example of an academic-community partnership is the Healthy Flint Research Coordinating Center (HFRCC). The HFRCC evaluates and must approve all research conducted in Flint, Michigan. HFRCC designs proposed studies that would align better with community concerns and context and ensures that benefits flow directly back to the community. Health equity is assessed holistically: considering the economic, environmental, behavioral, and physical health of residents. Finally, all work done in Flint is made open access through this organization. From these efforts we learn that communities can play a vital role in defining problems to solve and ensuring the research will be done with equity in mind.
An example of a federal agency-community partnership is the Environmental Protection Agency’s (EPA) Participatory Science Initiative. Through citizen science processes, the EPA has enabled data collection of under-monitored areas to identify climate-related and environmental issues that require both technical and policy solutions. The EPA helps to facilitate these citizen-science initiatives through providing resources on the best air monitoring equipment and how to then visualize field data. These initiatives specifically empower low-income and minority communities who face greater environmental hazards, but often lack power and agency to vocalize concerns.
Finally, communities themselves can be the generators of research projects, initially without a partner organization. In response to the lack of innovation in diabetic care management, Type 1 diabetic patients founded openAPS. This open source effort spurred the creation of an overnight, closed loop artificial pancreas system to reduce disease burden and save lives. Through decentralized deployment to over 2700 individuals, there are 63 million hours of real-world “closed-loop” data, with the results of prospective trials and randomized control trials (RCTs) showing fewer highs and less severe lows, i.e., greater quality of life. Thus, this innovation is now ripe for federal investment and partnership for it to reach a further critical scale.
Scaling participatory science requires infrastructure
Participatory science and innovation is still an emerging field. Yet, effective models for infrastructuring participation within scientific research enterprises have emerged over the past 20 years to build community engagement capacity of research institutions. Participatory research infrastructure (PRI) could take the form of the following:
- Offices that develop tools for interfacing with communities, like citizen’s juries, online platforms, deliberative forums, and future-thinking workshops.
- Ongoing technology assessment projects to holistically evaluate innovation and research along dimensions of equity, trust, access, etc.
- Infrastructure (physical and digital) for research, design experimentation, and open innovation led by community members.
- Organized stakeholder networks for co-creation and community-driven citizen science
- Funding resources to build CBO capacity to meaningfully engage (examples including the RADx-UP program from the NIH and Civic Innovation Challenge from NSF).
- Governance structures with community members in decision-making roles and requirements that CBOs help to shape the direction of the research proposals.
- Peer-review committees staffed by members of the public, demonstrated recently by NSF’s Regional Innovation Engines
- Coalitions that utilize research as an input for collective action and making policy and governance decisions to advance communities’ goals.
Call to action
The responsibility of federally-funded scientific research is to serve the public good. And yet, because there are so few interventions that have been scaled, participatory science will remain a “nice to have” versus an imperative for the scientific enterprise. To bring participatory science into the mainstream, there will need to be creative policy solutions that create incentive mechanisms, standards, funding streams, training ecosystems, assessment mechanisms, and organizational capacity for participatory science. To meet this moment, we need a broader set of voices contributing ideas on this aspect of open science and countless others. That is why we recently launched an Open Science Policy Sprint, in partnership with the Center for Open Science and the Wilson Center. If you have ideas for federal actions that can help the U.S. meet and exceed its open science goals, we encourage you to submit your proposals here.
Towards a Well-Being Economy: Establishing an American Mental Wealth Observatory
Summary
Countries are facing dynamic, multidimensional, and interconnected crises. The pandemic, climate change, rising economic inequalities, food and energy insecurity, political polarization, increasing prevalence of youth mental and substance use disorders, and misinformation are converging, with enormous sociopolitical and economic consequences that are weakening democracies, corroding the social fabric of communities, and threatening social stability and national security. Globalization and digitalization are synchronizing, amplifying, and accelerating these crises globally by facilitating the rapid spread of disinformation through social media platforms, enabling the swift transmission of infectious diseases across borders, exacerbating environmental degradation through increased consumption and production, and intensifying economic inequalities as digital advancements reshape job markets and access to opportunities.
Systemic action is needed to address these interconnected threats to American well-being.
A pathway to addressing these issues lies in transitioning to a Well-Being Economy, one that better aligns and balances the interests of collective well-being and social prosperity with traditional economic and commercial interests. This paradigm shift encompasses a ‘Mental Wealth’ approach to national progress, recognizing that sustainable national prosperity encompasses more than just economic growth and instead elevates and integrates social prosperity and inclusivity with economic prosperity. To embark on this transformative journey, we propose establishing an American Mental Wealth Observatory, a translational research entity that will provide the capacity to quantify and track the nation’s Mental Wealth, generate the transdisciplinary science needed to empower decision makers to achieve multisystem resilience, social and economic stability, and sustainable, inclusive national prosperity.
Challenge and Opportunity
America is facing challenges that pose significant threats to economic security and social stability. Income and wealth inequalities have risen significantly over the last 40 years, with the top 10% of the population capturing 45.5% of the total income and 70.7% of the total wealth of the nation in 2020. Loneliness, isolation, and lack of connection are a public health crisis affecting nearly half of adults in the U.S. In addition to increasing the risk of premature mortality, loneliness is associated with a three-fold greater risk of dementia.
Gun-related suicides and homicides have risen sharply over the last decade. Mental disorders are highly prevalent. Currently, more than 32% of adults and 47% of young people (18–29 years) report experiencing symptoms of anxiety and depression. The COVID-19 pandemic compounded the burden, with a 25–30% upsurge in the prevalence of depressive and anxiety disorders. America is experiencing a social deterioration that threatens its continued prosperity, as evidenced by escalating hate crimes, racial tensions, conflicts, and deepening political polarization.
To reverse these alarming trends in America and globally, policymakers must first acknowledge that these problems are interconnected and cannot effectively be tackled in isolation. For example, despite the tireless efforts of prominent stakeholder groups and policymakers, the burden of mental disorders persists, with no substantial reduction in global burden since the 1990s. This lack of progress is evident even in high-income countries where investments in and access to mental health care have increased.
Strengthening or reforming mental health systems, developing more effective models of care, addressing workforce capacity challenges, leveraging technology for scalability, and advancing pharmaceuticals are all vital for enhancing recovery rates among individuals grappling with mental health and substance use issues. However, policymakers must also better understand the root causes of these challenges so we can reshape the economic and social environments that give rise to common mental disorders.
Understanding and Addressing the Root Causes
Prevention research and action often focus on understanding and addressing the social determinants of health and well-being. However, this approach lacks focus. For example, traditional analytic approaches have delivered an extensive array of social determinants of mental health and well-being, which are presented to policymakers as imperatives for investment. These include (but are not limited to):
- Adverse early life exposures (abuse and neglect)
- Substance misuse
- Domestic, family, and community violence
- Unemployment
- Poverty and inequality
- Poor education quality
- Homelessness
- Social disconnection
- Food insecurity
- Pollution
- Natural disasters and climate change
This practice is replicated across other public health and social challenges, such as obesity, child health and development, and specific infectious and chronic diseases. Long lists of social determinants lobbied for investment lead policymakers to conclude that nations simply can’t afford to invest sufficiently to solve these health and social challenges.
However, it Is likely that many of these determinants and challenges are merely symptoms of a more systemic problem. Therefore, treating the ongoing symptoms only perpetuates a cycle of temporary relief, diverts resources away from nurturing innovation, and impedes genuine progress.
To create environments that foster mental health and well-being, where children can thrive and fulfill their potential, where people can pursue meaningful vocation and feel connected and supported to give back to communities, and where Americans can live a healthy, active, and purposeful life, policymakers must recognize human flourishing and prosperity of nations depends on a delicate balance of interconnected systems.
The Rise of Gross Domestic Product: An Imperfect Measure for Assessing the Success and Wealth of Nations
To understand the roots of our current challenges, we need to look at the history of the foundational economic metric, gross domestic product (GDP). While the concept of GDP had been established decades earlier, it was during a 1960 meeting of the Organization for Economic Co-operation and Development that economic growth became a primary ambition of nations. In the shadow of two world wars and the Great Depression, member countries pledged to achieve the highest sustainable economic growth, employment, efficiency, and development of the world economy as their top priority (Articles 1 & 2).
GDP growth became the definitive measure of a government’s economic management and its people’s welfare. Over subsequent decades, economists and governments worldwide designed policies and implemented reforms aimed at maximizing economic efficiency and optimizing macroeconomic structures to ensure consistent GDP growth. The belief was that by optimizing the economic system, prosperity could be achieved for all, allowing governments to afford investments in other crucial areas. However, prioritizing the optimization of one system above all others can have unintended consequences, destabilizing interconnected systems and leading to a host of symptoms we currently recognize as the social determinants of health.
As a result of the relentless focus on optimizing processes, streamlining resources, and maximizing worker productivity and output, our health, social, political, and environmental systems are fragile and deteriorating. By neglecting the necessary buffers, redundancies, and adaptive capacities that foster resilience, organizations and nations have unwittingly left themselves exposed to shocks and disruptions. Americans face a multitude of interconnected crises, which will profoundly impact life expectancy, healthy development and aging, social stability, individual and collective well-being, and our very ability to respond resiliently to global threats. Prioritizing economic growth has led to neglect and destabilization of other vital systems critical to human flourishing.
Shifting Paradigms: Building the Nation’s Mental Wealth
The system of national accounts that underpins the calculation of GDP is a significant human achievement, providing a global standard for measuring economic activity. It has evolved over time to encompass a wider range of activities based on what is considered productive to an economy. As recently as 1993, finance was deemed “explicitly productive” and included in GDP. More recently, Biden-Harris Administration leaders have advanced guidance for accounting for ecosystem services in benefit-cost analyses for regulatory decision-making and a roadmap for natural capital inclusion in the nation’s economic accounting services. This shows the potential to expand what counts as beneficial to the American economy—and what should be measured as a part of economic growth.
While many alternative indices and indicators of well-being and national prosperity have been proposed, such as the genuine progress indicator, the vast majority of policy decisions and priorities remain focused on growing GDP. Further, these metrics often fail to recognize the inherent value of the system of national accounts that GDP is based on. To account for this, Mental Wealth is a measure that expands the inputs of GDP to include well-being indicators. In addition to economic production metrics, Mental Wealth includes both unpaid activities that contribute to the social fabric of nations and social investments that build community resilience. These unpaid activities (Figure 1, social contributions, Cs) include volunteering, caregiving, civic participation, environmental restoration, and stewardship, and are collectively called social production. Mental Wealth also includes the sum of investment in community infrastructure that enables engagement in socially productive activities (Figure 1, social investment, Is). This more holistic indicator of national prosperity provides an opportunity to shift policy priorities towards greater balance between the economy and broader societal goals and is a measure of the strength of a Well-Being Economy.
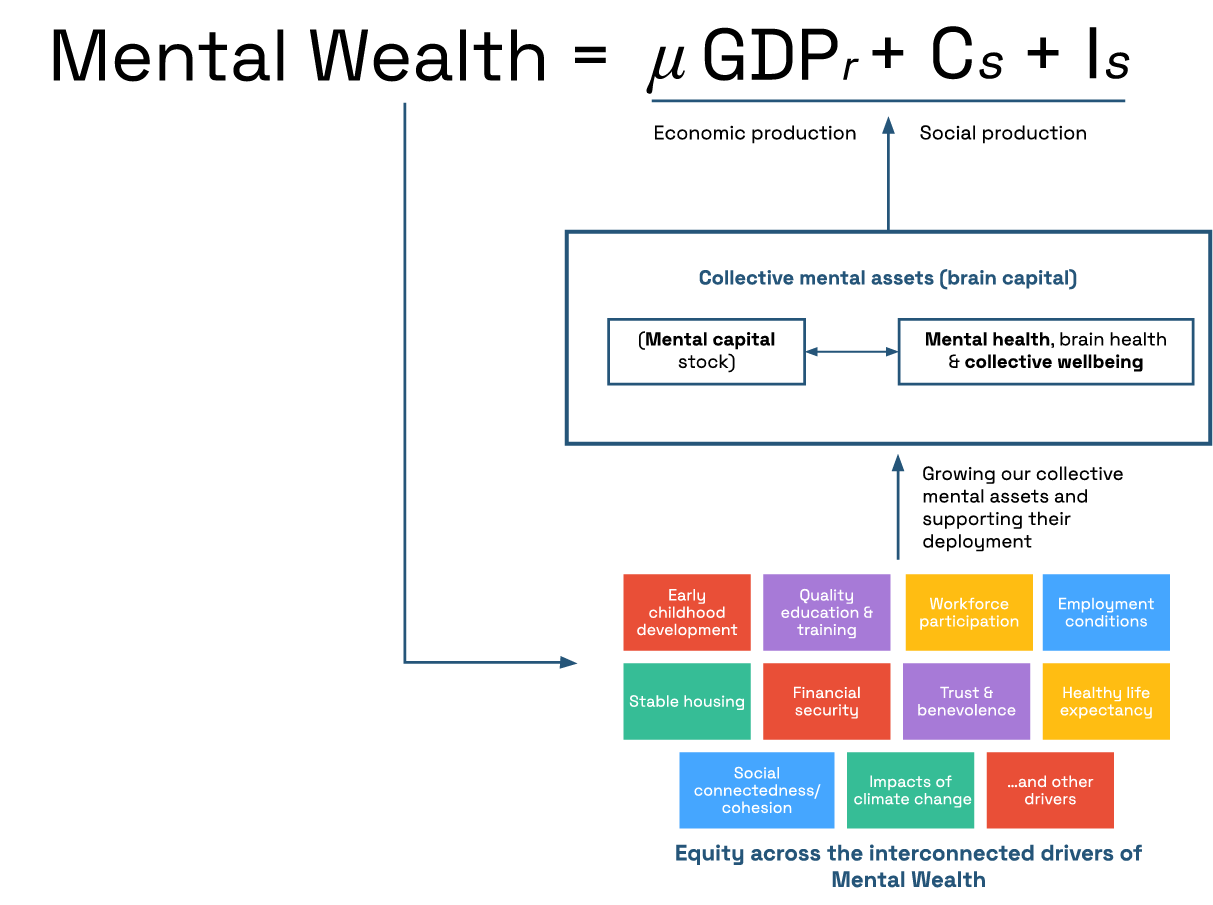
Mental wealth is a more comprehensive measure of national prosperity that monetizes the value generated by a nation’s economic and social productivity.
Valuing social production also promotes a more inclusive narrative of a contributing life, and it helps to rebalance societal focus from individual self-interest to collective responsibilities. A recent report suggests that, in 2021, Americans contributed more than $2.293 trillion in social production, equating to 9.8% of GDP that year. Yet social production is significantly underestimated due to data gaps. More data collection is needed to analyze the extent and trends of social production, estimate the nation’s Mental Wealth, and assess the impact of policies on the balance between social and economic production.
Unlocking Policy Insights through Systems Modeling and Simulation
Systems modeling plays a vital role in the transition to a Well-Being Economy by providing an understanding of the complex interdependencies between economic, social, environmental, and health systems, and guiding policy actions. Systems modeling brings together expertise in mathematics, biostatistics, social science, psychology, economics, and more, with disparate datasets and best available evidence across multiple disciplines, to better understand which policies across which sectors will deliver the greatest benefits to the economy and society in balance. Simulation allows policymakers to anticipate the impacts of different policies, identify strategic leverage points, assess trade-offs and synergies, and make more informed decisions in pursuit of a Well-Being Economy. Forecasting and future projections are a long-standing staple activity of infectious disease epidemiologists, business and economic strategists, and government agencies such as the National Oceanic and Atmospheric Administration, geared towards preparing the nation for the economic realities of climate change.
Plan of Action
An American Mental Wealth Observatory to Support Transition to a Well-Being Economy
Given the social deterioration that is threatening America’s resilience, stability, and sustainable economic prosperity, the federal government must systemically redress the imbalance by establishing a framework that privileges an inclusive, holistic, and balanced approach to development. The government should invest in an American Mental Wealth Observatory (Table 1) as critical infrastructure to guide this transition. The Observatory will report regularly on the strength of the Well-Being Economy as a part of economic reporting (see Table 1, Stream 1); generate the transdisciplinary science needed to inform systemic reforms and coordinated policies that optimize economic, environmental, health and social sectors in balance such as adding Mental Wealth to the system of national accounts (Streams 2–4); and engage in the communication and diplomacy needed to achieve national and international cooperation in transitioning to a Well-Being Economy (Streams 5–6).
This transformative endeavor demands the combined instruments of science, policy, politics, public resolve, social legislation, and international cooperation. It recognizes the interconnectedness of systems and the importance of a systemic and balanced approach to social and economic development in order to build equitable long-term resilience, a current federal interagency priority. The Observatory will make better use of available data from across multiple sectors to provide evidence-based analysis, guidance, and advice. The Observatory will bring together leading scientists (across disciplines of economics, social science, implementation science, psychology, mathematics, biostatistics, business, and complex systems science), policy experts, and industry partners through public-private partnerships to rapidly develop tools, technologies, and insights to inform policy and planning at national, state, and local levels. Importantly, the Observatory will also build coalitions between key cross-sectoral stakeholders and seek mandates for change at national and international levels.
The American Mental Wealth Observatory should be chartered by the National Science and Technology Council, building off the work of the White House Report on Mental Health Research Priorities. Federal partners should include, at a minimum, the Department of Health and Human Services (HHS) Office of the Assistant Secretary for Health (OASH), specifically the Office of the Surgeon General (OSG) and Office of Disease Prevention and Health Promotion (ODPHP); the Substance Abuse and Mental Health Services Administration (SAMHSA); the Office of Management and Budget; the Council of Economic Advisors (CEA); and the Department of Commerce (DOC), alongside strong research capacity provided by the National Science Foundation (NSF) and the National Institutes of Health (NIH).
Operationalizing the American Mental Wealth Observatory will require an annual investment of $12 million from diverse sources, including government appropriations, private foundations, and philanthropy. This funding would be used to implement a comprehensive range of priority initiatives spanning the six streams of activity (Table 2) coordinated by the American Mental Wealth Observatory leadership. Acknowledging the critical role of brain capital in upholding America’s prosperity and security, this investment offers considerable returns for the American people.
Conclusion
America stands at a pivotal moment, facing the aftermath of a pandemic, a pressing crisis in youth mental and substance use disorders, and a growing sense of disconnection and loneliness. The fragility of our health, social, environmental, and political systems has come into sharp focus, and global threats of climate change and generative AI loom large. There is a growing sense that the current path is unsustainable.
After six decades of optimizing the economic system for growth in GDP, Americans are reaching a tipping point where losses due to systemic fragility, disruption, instability, and civil unrest will outweigh the benefits. The United States government and private sector leaders must forge a new path. The models and approaches that guided us through the 20th century are ill-equipped to guide us through the challenges and threats of the 21st century.
This realization presents an extraordinary opportunity to transition to a Well-Being Economy and rebuild the Mental Wealth of the nations. An American Mental Wealth Observatory will provide the data and science capacity to help shape a new generation grounded in enlightened global citizenship, civic-mindedness, and human understanding and equipped with the cognitive, emotional, and social resources to address global challenges with unity, creativity, and resilience.
The University of Sydney’s Mental Wealth Initiative thanks the following organizations for their support in drafting this memo: FAS, OECD, Rice University’s Baker Institute for Public Policy, Boston University School of Public Health, the Brain Capital Alliance, and CSART.
Brain capital is a collective term for brain skills and brain health, which are fundamental drivers of economic and social prosperity. Brain capital comprises (1) brain skills, which includes the ability to think, feel, work together, be creative, and solve complex problems, and (2) brain health, which includes mental health, well-being, and neurological disorders that critically impact the ability to use brain skills effectively, for building and maintaining positive relationships with others, and for resilience against challenges and uncertainties.
Social production is the glue that holds society together. These unpaid social contributions foster community well-being, support our economic productivity, improve environmental wellbeing, and help make us more prosperous and resilient as a nation.
Social production includes volunteering and charity work, educating and caring for children, participating in community groups, and environmental restoration—basically any activity that contributes to the social fabric and community well-being.
Making the value of social production visible helps us track how economic policies are affecting social prosperity and allows governments to act to prevent an erosion of our social fabric. So instead of just measuring our economic well-being through GDP, measuring and reporting social production as well gives us a more holistic picture of our national welfare. The two combined (GDP plus social production) is what we call the overall Mental Wealth of the nation, which is a measure of the strength of a Well-Being Economy.
The Mental Wealth metric extends GDP to include not only the value generated by our economic productivity but also the value of this social productivity. In essence, it is a single measure of the strength of a Well-Being Economy. Without a Mental Wealth assessment, we won’t know how we are tracking overall in transitioning to such an economy.
Furthermore, GDP only includes the value created by those in the labor market. The exclusion of socially productive activities sends a signal that society does not value the contributions made by those not in the formal labor market. Privileging employment as a legitimate social role and indicator of societal integration leads to the structural and social marginalization of the unemployed, older adults, and the disabled, which in turn leads to lower social participation, intergenerational dependence, and the erosion of mental health and well-being.
Well-being frameworks are an important evolution in our journey to understand national prosperity and progress in more holistic terms. Dashboards of 50-80 indicators like those proposed in Australia, Scotland, New Zealand, Iceland, Wales, and Finland include things like health, education, housing, income and wealth distribution, life satisfaction, and more, which help track some important contributors to social well-being.
However, these sorts of dashboards are unlikely to compete with topline economic measures like GDP as a policy focus. Some indicators will go up, some will go down, some will remain steady, so dashboards lack the ability to provide a clear statement of overall progress to drive policy change.
We need an overarching measure. Measurement of the value of social production can be integrated into the system of national accounts so that we can regularly report on the nation’s overall economic and social well-being (or Mental Wealth). Mental Wealth provides a dynamic measure of the strength (and good management) of a Well-Being Economy. By adopting Mental Wealth as an overarching indicator, we also gain an improved understanding of the interdependence of a healthy economy and a healthy society.
Resources Library for the Model Data Governance Policy & Practice Guide
This library of Data Governance resources has been compiled in conjunction with the Task Force initiative, and contains links to a wide range of policies, practice tools, and associated background readings. Both the Guide and the Resources Library are meant to be “living” instruments accessible on the MetroLab Network website that can be updated, expanded, and refined over time.
Privacy Principles
The City of Seattle Privacy Principles | Seattle, Washington – 02/23/2015
Six privacy principles adopted by the city of Seattle regarding data collection.
Privacy Principles – Resolution No. 88701 | Oakland, California – 03/03/2020
The city council of Oakland established a resolution NO. 88701 that states seven privacy principles to protect the privacy of all Oakland residents, visitors, and the public.
Data Privacy and Information Protection Principles for the City of Portland | Portland, Oregon – 06/19/2019
Data Privacy and Information Protection Principles was adopted by the city of Portland in order to protect private and sensitive data managed by the city or those working on behalf of the city.
Data Privacy Principles | Kansas City, Missouri
Kansas City created data privacy principles in order to be a more transparent and accountable government while protecting the privacy of their citizens.
Data Privacy Principles | Minneapolis, Minnesota
The city council of Minneapolis adopted a data privacy principles resolution to incorporate shared values regarding data governance.
Data Privacy Principles | Hillsboro, Oregon
The city of Hillsboro adopted five data privacy principles in order to improve their data governance.
Privacy Principles | Mesa, Arizona
The city of Mesa adopted six privacy principles in order to protect the privacy of public information.
Public Data Principles | Boston, Massachusetts
The city of Boston adopted six public data principles to guide their data collection process and management infrastructure.
Link: https://www.boston.gov/departments/new-urban-mechanics/building-public-data-principles
Privacy Principles | Arlington, Virginia
The city of Arlington created privacy principles in order to improve and guide their data governance.
Privacy Principles | Syracuse, NY
The city of Syracuse built a section of privacy principles as part of their data privacy policy guide.
Privacy Principles | San José, California – 12/08/2020
The city of San José passed a digital privacy policy in which they included their privacy principles.
Privacy Principles for Mobility Data
These privacy principles are designed to guide the management of data in the mobility ecosystem.
Data Privacy Plan | Columbus, Ohio – 02/08/2019
The city of Columbus drafted a data privacy plan that provides an overarching framework for the ways in which Smart Columbus will protect the security of personal information that it collects and uses, and the privacy of the individuals to whom this information pertains.
Privacy Impact Assessments
Seattle Privacy Impact Assessment
This assessment conducts a review of how data is being collected and managed while determining different privacy risks.
Privacy Impact Assessment Policies Help Cities Use and Share Data Responsibly with their Communities by Future of Privacy Forum
This is a model dedicated for the government and communities working with personal data collected from smart city solutions.
Data Management
Data Management Strategy Overview | Dallas, Texas
The city of Dallas created a Data management strategy in order to improve their data governance practices.
Texas Data Management Framework Fast Start Learning Guide | State of Texas – Office of Chief Data Officer
This guide provides a summary of the DAMA DMBOK with a remark on practical principles and application for government.
San Francisco Data Management Policy, Section 1.0 – 01/17/19
San Francisco created a Data Management Policy.
Fostering Civic Trust: A Policy Guide for Municipal Leaders by USIgnite
This guide shows municipal leaders how to make informed decisions by explaining an ecosystem of civic trust: equity, data governance, privacy, cybersecurity, community engagement and equity.
US Ignite’s Fostering Civic Trust Guide (pg. 21-26)
This guide, created by USIgnite, provided a policy guide for municipal leaders; however, section 1.3 highlights the key consideration for data sharing specifically.
The Data Assembly – Responsible Data Re-Use Framework
The GovLab and Henry Luce Foundation created this data assembly report in order to highlight the importance of re-use data especially after the covid-19 pandemic.
Responsible Data Stewardship from Open Data Institute (OPI) – London
This guide illustrates how to implement responsible data stewardship, and it highlights several principles to consider.
Mobility Data State of Practice from Open Mobility Foundation
This document compiles several data resources for cities to use as examples such as privacy principles, open data policies, data sharing, and so on.
Beeck Center Data Labs Playbook by Georgetown University
This is a Data Labs Playbook that serves as a guide for public servants who are interested in launching a data-informed project in their state.
Data Management by NYC – Guidelines for Internet of Things
This is an example of how NYC manages, collects, and processes data.
Defining a Data Intermediary from Civic Switchboard Guide
These are three strategies to identify a data intermediary.
Dataset Inventory | San Francisco, California
This is an example of a dataset inventory provided by the city of San Francisco.
San José Digital Privacy and AI Manual – 05/16/2023
This manual aims to guide the city of San José on matters of digital privacy and artificial intelligence.
TOOL: What Works Cities (WWC)
WWC has a certification program that cities can take in order to become more data driven.
TOOL: Resource Library from the city of San Francisco
The city of San Francisco has been working closely with data; therefore, they created this resource library that includes their data resources such as data toolkits and open data metrics.
Open Data Policies
Open Data Policy and Technical Standards Manual for the City and County of Honolulu | Honolulu, Hawaii – 06/2022
This is a manual regarding open data policy created by the city of Honolulu in order to improve their open data practices.
Open Data Policy | Boulder, Colorado
This open data policy was established to provide transparent and secure open data in Boulder county.
Open and Protected Data Policy | Boston, Massachusetts
The city of Boston created an open and protected data policy in order to improve their data governance.
Executive Order – 02-2013: Establishment of Open Data Policy and Portal for Public Information | South Bend, Indiana
South Bend established an executive order NO. 2-2013 that will describe open data policy and portal for public information.
Seattle Open Data Policy – 02/01/2016
This Open Data Policy defines the principles governing City of Seattle Open Data and describes the expectations for department participation and governance of the Seattle open data program.
City of Charlotte Open Data Policy | Charlotte, North Carolina – 01/01/2015
The city of Charlotte adopted an open data policy.
Open Data Policy – Section 2-2130 | Kansas City, Missouri – 10/22/2015
The city council of Kansas City passed an ordinance NO. 150865 that states an open data policy in order to promote openness and transparency while protecting the privacy of their citizens.
Open Data – Executive Order | Louisville, Kentucky – 10/15/2013
The city of Louisville passed an executive order that established their open data policy in order to improve their data governance.
Seattle Open Data Program
Seattle has an open data program, in which they also include several open data resources.
Open Data Standard Operating Procedure (SOP) Manual | City of Aurora, Illinois – Revised 12/02/2022
This is a manual created by the city of Aurora that focuses on open data in order to improve their data practices.
TOOL: US City Open Data Census
This site illustrates an overview of the degree of openness of specific key dataset in cities across the United States.
TOOL: Open Data from New York City
New York City has a website that provides different resources to find or request open data.
TOOL: Mapping Data Ecosystem from the Open Data Institute (OPI) – London
This guide provides a tool for documenting and mapping the data ecosystem.
TOOL: City of Aurora Open Data Portal
This is an open data portal that allows the public to access open data of the city of Aurora.
Data Governance Policies
Protected Data Privacy Policy – Executive Order NO. 143 | City of Denver, Colorado – 02/16/2018
The mayor, Michael B. Hancock, passed an executive order NO. 143 that established a protected data privacy policy for the city and county of Denver.
Establish Privacy and Information Protection Principles for how the City collects, uses, manages, and disposes of data and information presentation – Resolution NO. 37437 | Portland, Oregon – 06/19/2019
The city of Portland passed a resolution NO. 37437, which established privacy and information protection principles that the city will follow when gathering data.
District of Columbia Data Policy – Mayor’s Order 2017-115 | Washington DC – 04/27/2017 & Amended 06/18/2018
This is a mayor’s order that provides a comprehensive data policy for the District of Columbia government.
Personal Data Collection and Protection Ordinance | City of Chicago, Illinois
The city of Chicago passed an ordinance that regulates how operators collect sensitive customer personal information through the Internet about individual consumers in the city of Chicago.
Data Collection Policy | South Bend, Indiana
The city of South Bend has incorporated a data collection policy that states how they collect, manage, and publish data.
Resolution – 20111208074 | Austin, Texas – 12/08/2011
The city of Austin passed a resolution NO. 20111208074.
Data Privacy Guidelines – 01/2021 | Long Beach, California
Long Beach created a data privacy guideline that incorporates data privacy principles and guidelines when working with data.
Seattle Privacy Program
Seattle has implemented a privacy program.
Using MDS under GDPR
This guide is specifically for European nations since it is related to the General Data Protection Regulation, which is European Union regulation; however, it can be an interesting reading for cities.
Data Quality Standards and Review Process | New York City, New York
NYC Open Data Team and Office of Technology and Innovation created a guide with data quality standards for Open Data Coordinators and Data owners to follow.
Privacy Policy for Smart.Columbus.gov | Columbus, Ohio
The city of Columbus created this privacy policy that will be applied when the city or its partners are collecting personal information.
California Consumer Privacy Act (CCPA) – 2018
This act allows consumers to have more control over their personal information when businesses are collecting that information.
NYC Guidelines for the Internet of Things (IoT) – Privacy + Transparency
This website illustrates how the city of IoT provides privacy and transparency to their residents.
Data Sharing Agreements
Data Sharing MOU (Memorandum of Understanding) template
This template, made by Arlington County, illustrates a MOU between university partners, and data classification guidelines as well.
Data Labs: Roadmap to Recovery Example Data Sharing Agreements (or MOUs/MOAs)
This is a collection of examples and articles about Data Sharing MOUs from Beeck Center (at Georgetown University).
Enterprise Memorandum of Understanding by the state of Connecticut
This is an example E-MOU presented between several parties such as the State Board of Education, Office of Early Childhood, and so on, and Connecticut Office of Policy and Management, and Connecticut Department of Labor.
Memorandum of Understanding by the state of Kentucky
This is an example between different state agencies to audit/evaluate education programs and to authorize the release and use of confidential data.
SBA Disaster Data Sharing MOU and Instructions
This document, provided by the U.S. Small Business Administration, drafts an example for local and state governments who are entering into a MOU with the Office of Capital Accessd in order to prevent duplication of benefits.
NCDHSS Data Sharing Guidebook
This guide, created by the North Carolina Department of Health and Human Services, provides clear processes for data sharing and integration.
State of Connecticut Data Sharing Playbook
This is an example of an operationalization focused playbook that includes data sharing that includes templates and walkthroughs.
Assessing risk when sharing data: a guide from the Open Data Institute (OPI) | London
This guide provides the early steps organizations need to take when sharing data in order to reduce and manage the risks.
Platform Urbanism Data Sharing (PUDS) Policy Hub and its Best Practices Recommendations
This is a two-part resource providing relevant recommendations and supporting materials regarding Data Sharing linked to policies from several jurisdictions.
Data Labs
Data Labs presented a series of case studies for data owners, especially those working with PII (Personal Identifiable Information) on how to improve their data practices.
Beatriz Botero Arcila, The Case for Local Data Sharing Ordinances, 30 Wm. & Mary Bill Rts. 1015 (2022)
This is an academic article that describes the current relationship between the Fourth Amendment and privacy laws when sharing data.
Megan Marini, Troy Simpson, and Priyanka Jain, A Rhode Trip: Lessons for the Future of Mobility From the Little Roady Autonomous Microstransit Pilot (2022)
This article talks about the Little Roady pilot project and the challenges of data sharing limitations.
TOOL: What Works Cities (WWC)
WWC has a certification program that cities can take in order to become more data driven.
TOOL: Data Collaboratives Explorer from GOVLAB
GOVLAB provides data collaboration between public and private partnerships across the globe, so they can create public value.
TOOL: Contractors for Data Collaboration (C4DC)
C4DC aims to improve understanding of the legal conditions that can enable effective data collaboration.
Cybersecurity
Integrating Cybersecurity and Enterprise Risk Management (ERM) – NISTIR 8266 (National Institute of Standards and Technology – US Department of Commerce)
This is a publication by NISTIR that highlights the importance of cybersecurity risk in all enterprises because of the frequency and increase of cyberattacks.
The NIST Privacy Framework: A Tool for Improving Privacy through Enterprise Risk Management
This tool provides better privacy practices that will support organizations to protect individuals’ privacy.
Framework for Improving Critical Infrastructure Cybersecurity by NIST
This website provides several standards, and a cybersecurity framework.
ISO/IEC 27001 – Information security management systems
These are standards for information security management systems (ISMS) for companies of all sizes.
ISO/IEC 27002 – Information Security, cybersecurity, and privacy protection – Information security controls
This is a document that provides organizations with generic information on security controls.
Standards for Security Categorization of Federal Information and Information System – FIPS 199
This document is provided by NITS, and it states a standard for categorizing federal information and information systems.
Citywide Cybersecurity Policy | San Francisco, California
San Francisco created a citywide cybersecurity policy in order to support, maintain, and secure data systems.
Information Security Policy | Chicago, Illinois
This policy states the role for data security, requirements for protecting sensitive data, and mission critical systems, and protects the city’s systems and data
Cybersecurity Best Practices for Smart Cities
This guidance was created by different countries’ cybersecurity agencies in order to integrate information and communication technologies, community wide data, and operational technology.
PCI (Payment Card Industry) – Privacy Security Council
This is a global forum dedicated to protect account data security by developing standards and resources in the payment card industry.
Security from NYC – Internet of Things
This is an example of how the aspect of security regarding data is handled in NYC.
San Francisco City-wide IT focused – Disaster Preparedness, Response, Recovery, and Resilience Policy
San Francisco developed a DPR3 that will ensure the delivery of public services during, and after a disaster.
Data Classifications
Data Classification Standard | San Francisco, California
The city of San Francisco created a data classification standard that requires departments inside the city government to categorize and label data per classification levels.
Data Policy – Dataset Classification | Washington DC, District of Columbia
Washington, DC created a data policy that also provides dataset classification that other cities can utilize.
Data Security: Policies and Regulations Impacting Research Data from University of North Carolina
This provides a definition for sensitive data, and level of sensitive information followed by University of North Carolina.
Operationalization
Appointment of Chief Data Officer – Resolution NO. 2019-30869 | Miami, Florida – 06/26/2019
This is an example of a resolution issued by the mayor and city of Miami to appoint a data chief officer and its responsibilities.
Eight Strategies for Chief Data Officers to create and demonstrate value by Harvard Business Review
This article illustrates different strategies that Chief Data Officers can implement to strengthen their value.
DatSF Guidebook: Data Coordinators Edition
This guide is directly to Data Coordinators in the city and county of San Francisco to provide guidance in their new role.
The Chief Data Officer in Government
This is a playbook created by Deloitte Center for Government Insights that provides roles and responsibilities for a government Chief Data Officer (p. 3-4).
Checklist: The city of Asheville, NC Technology Procurement Checklist
This is an example of questions that the city of Asheville asked when purchasing technology.
TOOL: Data Ethics Maturity Model: Benchmarking your approach to data ethics from the Open Data Institute (OPI) | London
This tool allows organizations that work with data to benchmark their maturity in relation with data ethics.
Community Engagement and Resident Feedback
CUTGroup Chicago – Engaged their community (pg. 1)
This is the completed guide that explains the CUTGroup in detail.
Chicago Tech Collaborative CUTGroup
It shows the latest projects CUTGroup Chicago has been working on.
CUTGruops Detroit
It is a tester pool that brings Detroit residents to evaluate civic websites and apps, and it also provides several data literacy training sessions.
CUTGroups Seattle
This article describes the creation of Civic User Testing Group in the city of Seattle.
The Spectrum of Community Engagement Ownership
This guide was provided by the Facilitating Power and it draws a pathway for local democracies to strengthen and transform.
An opportunity for community leaders
This article presented by SmartCity PDX, in which states two innovative ways for engaging community leaders.
Community Leads Request for Smart City PDX Program
This is an example provided by the city of Portland regarding a position as community leads in order to close the gap between technology and marginalized communities.
Link:
Participatory Data Stewardship
This is a report provided by Ada Lovelace Institute that provides a framework for involving people in use of data.
City Leader Guide on Civic Engagement from Bloomerang Harvard
This guide provides analytic tools for city leaders to engage residents in public problem-solving, and facilitating innovative practices.
OECD Innovative Citizen Participation and New Democratic Institutions: Catching the Deliberative Wave
This is an informative resource that provides several models of deliberative processes.
IAP2 Spectrum of Public Participation
This is an example of how to collect public participation.
Seattle Community Technology Board
The city of Seattle created a community technology board, which provides recommendations to the Mayor and City Council regarding information and communications technology as well as effective electronic civic engagement.
TOOL: KC Digital Drive, Code for KC and Missouri Western University launch Kansas City’s First Civic UX testing group
Civic UX Testing group is a tool created by KC Digital drive with the goal to build technology applications to help resolve social and civic issues.
Chicago Tech Collaborative’s Civic Design & User Testing initiative (“CUTGroup”)
CUTGroup is a civic engagement program that provides a space to Chicago residents to contribute to emerging technology while providing feedback to public, privacy and social sector partners.
Additional Background Readings
Legal Technology Laboratory
The Legal Technology Laboratory is a community of practice platform designed to promote collaborations by innovators at intersections of law, technology, education, and entrepreneurship and empower multidisciplinary teams to address social, civic, and economic development challenges with technology-assisted solutions and data-driven policy development.
General Services Administration, Rules and Policies – Protecting PII – Privacy Act (11/15/2018)
The U.S. General Services and Administration drafted a set of rules and behaviors to follow when handling personally identifiable information.
NYC Internet of Things
NYC Internet of Things along with other 35 cities help government and their partners to responsibly deploy connected devices and IoT (Internet of Things) technologies
Cf. REGULATION (EU) 2016/679 OF THE EUROPEAN PARLIAMENT AND OF THE COUNCIL
On 27 April 2016. On the protection of natural persons with regard to the processing of personal data and on the free movement of such data, and repealing Directive 95/46/EC (General Data Protection Regulation-“GDPR”) – Paragraph 32. This is a regulation established by the European Parliament that states the importance of protecting one’s personal data.
Algorithmic bias detention and mitigation: Best Practices and policies to reduce consumer harms
This article was published by the Brookings in 2019, it describes the current mass-scale digitization of data and the consequences of it in different sectors such as in economics, transportations, retail, and other areas.
Bias Mitigation in Data Sets
This article describes the different ways bias can happen in datasets, and it was published by SOCARXIV, an open archive of social science.
Michael Juerens, Social Media Risks Create an Expanded Role for Internal Audit from The Wall Street Journal (08/06/2013)
The Wall Street Journal published an article describing the different threats that social media can create; therefore, it is crucial to create internal audits.
Beatriz Botero Arcila, Sharing Data in the Sharing Economy: Policy Recommendations for Local Governments. 9 Indiana J. Law and Society Equity 1 (2021)
Indiana Journal of Law and Social Equality published this academic article that provides policy recommendations when daring data in the sharing economy.
The City needs to make realistic commitments to voters and ensure they are delivered
This is an example of an audit made to the city of Portland regarding accountability for voter-approved taxes.
Data Labs
Data Labs presented a series of case studies for data owners, especially those working with PII (Personal Identifiable Information) on how to improve their data practices.
Privacy Guide For Cities & Public Agencies from Open Mobility Foundation – 03/17/2023
This guide was developed by the Open Mobility Foundation and the Privacy, Security, and Transparency Committee to orient cities as technologies transform cities’ transportation networks.
Mozilla’s framework notes for data commons governance
This article provides a framework when applying Ostrom’s principles to data commons governance.
The softer side for data governance: a playbook for non-technical users from the Open Data Institute (OPI) | London
This playbook is directly to non-technical users leaders in the healthcare field who work with data on their daily basis.
Sovereign immunity in the age of continuous cyber warfare – 07/15/2015
This article describes the importance of sovereign immunity, and its implication against cyber attacks.
Distinguishing Between Governmental and Property Functions (Chapter 2 of Local Government Immunity to Lawsuits in North Carolina (2018)
This chapter talks about the origin of the distinction in immunity cases and its relationship with the judiciary’s role.
Sean Andrés Rapela, The Ugly Truth Cyber Security Insurance & Governmental Data Breaches, 21 J. High Tech. L. 242 (2021)
This academic article states the increased number of cyberattacks while also proposing a cyber relief program.
Rebekah Luna, Stranger Danger!: How Hackers Break Into School Databases to Steal Student Data, and What Legislatures Should Do About It, 54 Tex. Tech L. Re. 381 (2022)
This academic article refers to schools as easy targets for cyber attacks due to the lack of legislation in this matter.
How to know you are a “data intermediary” under the Data Governance Act from the International Association of Privacy Professionals (IAPP)
This is an article that describes the roles of data intermediary while following the Data Governance Act
FOIA (Freedom of Information Act)
This is the central website for FOIA that cities can check for any new regulations.
European Union’s General Data Protection Regulation (GDPR)
This is a resource that will help organizations and individuals when working with the General Data Protection of the European Union.
Privacy Definition & Legal Meaning in the online version of Black’s Law Dictionary (2ND Ed.)
This website provides a legal definition of privacy, and divides it into four categories.
Cities Partner on Model Policy for Handling Municipal Data
This article was published by Government Technology in 2020, and it provides some insight regarding the early stages of the Data Governance Policy.
Tilling the Federal SOIL for Transformative R&D: The Solution Oriented Innovation Liaison
Summary
The federal government is increasingly embracing Advanced Research Projects Agencies (ARPAs) and other transformative research and engagement enterprises (TREEs) to connect innovators and create the breakthroughs needed to solve complex problems. Our innovation ecosystem needs more of these TREEs, especially for societal challenges that have not historically benefited from solution-oriented research and development. And because the challenges we face are so interwoven, we want them to work and grow together in a solution-oriented mode.
The National Science Foundation (NSF)’s new Directorate for Technology, Innovation and Partnerships should establish a new Office of the Solution-Oriented Innovation Liaison (SOIL) to help TREEs share knowledge about complementary initiatives, establish a community of practice among breakthrough innovators, and seed a culture for exploring new models of research and development within the federal government. The SOIL would have two primary goals: (1) provide data, information, and knowledge-sharing services across existing TREEs; and (2) explore opportunities to pilot R&D models of the future and embed breakthrough innovation models in underleveraged agencies.
Challenge and Opportunity
Climate change. Food security. Social justice. There is no shortage of complex challenges before us—all intersecting, all demanding civil action, and all waiting for us to share knowledge. Such challenges remain intractable because they are broader than the particular mental models that any one individual or organization holds. To develop solutions, we need science that is more connected to social needs and to other ways of knowing. Our problem is not a deficit of scientific capital. It is a deficit of connection.
Connectivity is what defines a growing number of approaches to the public administration of science and technology, alternatively labeled as transformative innovation, mission-oriented innovation, or solutions R&D. Connectivity is what makes DARPA, IARPA, and ARPA-E work, and it is why new ARPAs are being created for health and proposed for infrastructure, labor, and education. Connectivity is also a common element among an explosion of emerging R&D models, including Focused Research Organizations (FROs) and Distributed Autonomous Organizations (DAOs). And connectivity is the purpose of NSF’s new Directorate for Technology, Innovation and Partnerships (TIP), which includes “fostering innovation ecosystems” in its mission. New transformative research and engagement enterprises (TREEs) could be especially valuable in research domains at the margins, where “the benefits of innovation do not simply trickle down.
The history of ARPAs and other TREEs shows that solutions R&D is successfully conducted by entities that combine both research and engagement. If grown carefully, such organisms bear fruit. So why just plant one here or there when we could grow an entire forest? The metaphor is apt. To grow an innovation ecosystem, we must intentionally sow the seeds of TREEs, nurture their growth, and cultivate symbiotic relationships—all while giving each the space to thrive.
Plan of Action
NSF’s TIP directorate should create a new Office of Solution-Oriented Innovation (SOIL) to foster a thriving community of TREEs. SOIL would have two primary goals: (1) nurture more TREEs of more varieties in more mission spaces; and (2) facilitate more symbiosis among TREEs of increasing number and variety.
Goal 1: More TREEs of more varieties in more mission spaces
SOIL would shepherd the creation of TREEs wherever they are needed, whether in a federal department, a state or local agency, or in the private, nonprofit, or academic sectors. Key to this is codifying the lessons of successful TREEs and translating them to new contexts. Not all such knowledge is codifiable; much is tacit. As such, SOIL would draw upon a cadre of research-management specialists who have a deep familiarity with different organizational forms (e.g., ARPAs, FROs, DAOs) and could work with the leaders of departments, businesses, universities, consortia, etc. to determine which form best suits the need of the entity in question and provide technical assistance in establishment.
An essential part of this work would be helping institutions create mission-appropriate governance models and cultures. Administering TREEs is neither easy nor typical. Indeed, the very fact that they are managed differently from normal R&D programs makes them special. Former DARPA Director Arati Prabhakar has emphasized the importance of such tailored structures to the success of TREEs. To this end, SOIL would also create a Community of Cultivators comprising former TREE leaders, principal investigators (PIs), and staff. Members of this community would provide those seeking to establish new TREEs with guidance during the scoping, launch, and management phases.
SOIL would also provide opportunities for staff at different TREEs to connect with each other and with collective resources. It could, for example, host dedicated liaison officers at agencies (as DARPA has with its service lines) to coordinate access to SOIL resources and other TREEs and support the documentation of lessons learned for broader use. SOIL could also organize periodic TREE conventions for affiliates to discuss strategic directions and possibly set cross-cutting goals. Similar to the SBIR office at the Small Business Administration, SOIL would also report annually to Congress on the state of the TREE system, as well as make policy recommendations.
Goal 2: More symbiosis among TREEs of increasing number and variety
Success for SOIL would be a community of TREEs that is more than the sum of its parts. It is already clear how the defense and intelligence missions of DARPA and IARPA intersect. There are also energy programs at DARPA that might benefit from deeper engagement with programs at ARPA-E. In the future, transportation-infrastructure programs at ARPA-E could work alongside similar programs at an ARPA for infrastructure. Fostering stronger connections between entities with overlapping missions would minimize redundant efforts and yield shared platform technologies that enable sector-specific advances.
Indeed, symbiotic relationships could spawn untold possibilities. What if researchers across different TREEs could build knowledge together? Exchange findings, data, algorithms, and ideas? Co-create shared models of complex phenomena and put competing models to the test against evidence? Collaborate across projects, and with stakeholders, to develop and apply digital technologies as well as practices to govern their use? A common digital infrastructure and virtual research commons would enable faster, more reliable production (and reproduction) of research across domains. This is the logic underlying the Center for Open Science and the National Secure Data Service.
To this end, SOIL should build a digital Mycelial Network (MyNet), a common virtual space that would harness the cognitive diversity across TREEs for more robust knowledge and tools. MyNet would offer a set of digital services and resources that could be accessed by TREE managers, staff, and PIs. Its most basic function could be to depict the ecosystem of challenges and solutions, search for partners, and deconflict programs. Once partnerships are made, higher-level functions would include secure data sharing, co-creation of solutions, and semantic interconnection. MyNet could replace the current multitude of ad hoc, sector-specific systems for sharing research resources, giving more researchers access to more knowledge about complex systems and fewer obstacles from paywalls. And the larger the network, the bigger the network effects. If the MyNet infrastructure proves successful for TREEs, it could ultimately be expanded more broadly to all research institutions—just as ARPAnet expanded into the public internet.
For users, MyNet would have three layers:
- A data layer for archive and access
- An information layer for analysis and synthesis
- A knowledge layer for creating meaning in terms of problems and solutions
These functions would collectively require:
- Physical structures: The facilities, equipment, and workforce for data storage, routing, and cloud computing
- Virtual structures: The applications and digital environments for sharing data, algorithms, text, and other media, as well as for remote collaboration in virtual laboratories and discourse across professional networks
- Institutional structures: The practices and conventions to promote a robust research enterprise, prohibit dangerous behavior, and enforce community data and information standards.
How might MyNet be applied? Consider three hypothetical programs, all focused on microplastics: a medical program that maps how microplastics are metabolized and impact health; a food-security program that maps how microplastics flow through food webs and supply chains; and a social justice program that maps which communities produce and consume microplastics. In the data layer, researchers at the three programs could combine data on health records, supply logistics, food inspections, municipal records, and demographics. In the information layer, they might collaborate on coding and evaluating quantitative models. Finally, in the knowledge layer, they could work together to validate claims regarding who is impacted, how much, and by what means.
Initial Steps
First, Congress should authorize and appropriate the NSF TIP Directorate with $500 million over four years for a new Office of the Solution-Oriented Innovation Liaison. Congress should view SOIL as an opportunity to create a shared service among emergent, transformative federal R&D efforts that will empower—rather than bureaucratically stifle—the science and technological advances we need most. This mission fits squarely under the NSF TIP Directorate’s mandate to “mobilize the collective power of the nation” by serving as “a crosscutting platform that collaboratively integrates with NSF’s existing directorates and fosters partnerships—with government, industry, nonprofits, civil society and communities of practice—to leverage, energize and rapidly bring to society use-inspired research and innovation.”
Once appropriated and authorized to begin intentionally growing a network of TREEs, NSF’s TIP Directorate should focus on a four-year plan for SOIL. TIP should begin by choosing an appropriate leader for SOIL, such as a former director or directorate manager of an ARPA (or other TREE). SOIL would be tasked with first engaging the management of existing ARPAs in the federal government, such as those at the Departments of Defense and Energy, to form an advisory board. The advisory board would in turn guide the creation of experience-informed operating procedures for SOIL to use to establish and aid new TREEs. These might include discussions geared toward arriving at best practices and mechanisms to operate rapid solutions-focused R&D programs for the following functions:
- Hiring services for temporary employees and program managers, pipelines to technical expertise, and consensus on out-of-government pay scales
- Rapid contracting toolkits to acquire key technology inputs from foreign and domestic suppliers
- Research funding structures than enable program managers to make use of multiple kinds of research dollars in the same project, in a coordinated fashion, managed by one entity, and without needing to engage different parts of different agencies
- Early procurement for demonstration, such that mature technologies and systems can transition smoothly into operational use in the home agency or other application space
- The right vehicles (e.g., FFRDCs) for SOIL to subcontract with to pursue support structures on each of these functions
- The ability to define multiyear programs, portfolios, and governance structures, and execute them at their own pace, off-cycle from the budget of their home agencies
Beyond these structural aspects, the board must also incorporate important cultural aspects of TREES into best practices. In my own research into the managerial heuristics that guide TREEs, I found that managers must be encouraged to “drive change” (critique the status quo, dream big, take action), “be better” (embrace difference, attract excellence, stand out from the crowd), “herd nerds” (focus the creative talent of scientists and engineers), “gather support” (forge relationships with research conductors and potential adversaries), “try and err” (take diverse approaches, expect to fail, learn from failure), and “make it matter” (direct activities to realize outcomes for society, not for science).
The board would also recommend a governance structure and implementation strategy for MyNet. In its first year, SOIL could also start to grow the Community of Cultivators, potentially starting with members of the advisory board. The board chair, in partnership with the White House Office of Science and Technology Policy, would also convene an initial series of interagency working groups (IWGs) focused on establishing a community of practice around TREEs, including but not limited to representatives from the following R&D agencies, offices, and programs:
- DARPA
- ARPA-E
- IARPA
- NASA
- National Institutes of Health
- National Institute for Standards and Technology
In years two and three, SOIL would focus on growing three to five new TREEs at organizations that have not had solutions-oriented innovation programs before but need them.
- If a potential TREE opportunity is found at another agency, SOIL should collaborate with the agency’s R&D teams to identify how the TREEs might be pursued and consult the advisory board on the new mission space and its potential similarities and differences to existing TREEs. If there is a clear analogue to an existing TREE, the SOIL should use programmatic dollars to detail one or two technical experts for a one-year appointment to the new agency’s R&D teams to explore how to build the new TREE.
- If a potential TREE opportunity is found at a government-adjacent or external organization such as a new Focused Research Organization created around a priority NSF domain, SOIL should leverage programmatic dollars to provide needed seed funding for the organization to pursue near-term milestones. SOIL should then recommend to the TIP Directorate leadership the outcomes of these near-term pilot supports and whether the newly created organization should receive funds to scale. SOIL may also consider convening a round of aligned philanthropic and private funders interested in funding new TREEs.
- If the opportunity concerns an existing TREE, there should be a memorandum of understanding (MOU) and or request for funding process by which the TREE may apply for off-cycle funding with approval from the host agency.
SOIL would also start to build a pilot version of MyNet as a resource for these new TREEs, with a goal of including existing ARPAs and other TREEs as quickly as possible. In establishing MyNet, SOIL should focus on implementing the most appropriate system of data governance by first understanding the nature of the collaborative activities intended. Digital research collaborations can apply and mix a range of different governance patterns, with different amounts of availability and freedoms with respect to digital resources. MyNet should be flexible enough to meet a range of needs for openness and security. To this end, SOIL should coordinate with the recently created National Secure Data Service and apply lessons forward in creating an accessible, secure, and ethical information-sharing environment.
Year four and beyond would be characterized by scaling up. Building on the lessons learned in the prior two years of pilot programs, SOIL would coordinate with new and legacy TREEs to refresh operating procedures and governance structures. It would then work with an even broader set of organizations to increase the number of TREEs beyond the three to five pilots and continue to build out MyNet as well as the Community of Cultivators. Periodic evaluations of SOIL’s programmatic success would shape its evolution after this point. These should be framed in terms of its capacity to create and support programs that yield meaningful technological and socioeconomic outcomes, not just produce traditional research metrics. As such, in its creation of new TREEs, SOIL should apply a major lesson of the National Academies’ evaluation of ARPA-E: explicitly align the (necessarily) robust performance management systems at the project level with strategy and evaluation systems at the program, portfolio, and agency levels. The long-term viability of SOIL and TREEs will depend on their ability to demonstrate value to the public.
The transformative research model typically works like this:
- Engage with stakeholders to understand their needs and set audacious goals for addressing them.
- Establish lean projects run by teams of diverse experts assembled just long enough to succeed or fail in one approach.
- Continuously evaluate projects, build on what works, kill what doesn’t, and repeat as necessary.
In a nutshell, transformative research enterprises exist solely to solve a particular problem, rather than to grow a program or amass a stock of scientific capital.
To get more specific, Bonvillian and Van Atta (2011) identify the unique factors that contribute to the innovative nature of ARPAs. On the personnel front, ARPA program managers are talented managers, experienced in business, and appointed for limited terms. They are “translators,” as opposed to subject-matter experts, who actively engage with allies, rivals, and others. They have great power to choose projects, hire, fire, and contract. On the structure front, projects are driven by specific challenges or visions—co-developed with stakeholders—designed around plausible implementation pathways. Projects are executed extramurally, and managed as portfolios, with clear metrics to asses risk and reward. Success for ARPAs means developing products and services that achieve broad uptake and cost-efficacy, so finding first adopters and creating markets is part of the work.
Some examples come from other Day One proposals. SOIL could work with the Department of Labor to establish a Labor ARPA. It could work with the Department of Education on an Education ARPA. We could imagine a Justice Department ARPA with a program for criminal justice reform, one at Housing and Urban Development aimed at solving homelessness, or one at the State Department for innovations in diplomacy. And there are myriad opportunities beyond the federal government.
TREEs thrive on their independence and flexibility, so SOIL’s functions must be designed to impose minimal interference. Other than ensuring that the TREEs it supports are effectively administered as transformative, mission-oriented organizations, SOIL would be very hands-off. SOIL would help establish TREEs and set them up so they do not operate as typical R&D units. SOIL would give TREE projects and staff the means to connect cross-organizationally with other projects and staff in areas of mutual interest (e.g., via MyNet, the Community of Cultivators, and periodic convenings). And, like the SBIR office at the Small Business Administration, SOIL would report annually to Congress on its operations and progress toward goals.
An excellent model for SOIL is the Small Business Innovative Research (SBIR) system. SBIR is funded by redirecting a small percentage of the budgets of agencies that spend $100 million or more on extramural R&D. Given that SOIL is intended to be relevant to all federal mission spaces, we recommend that SOIL be funded by a small fraction (between 0.1 and 1.0%) of the budgets of all agencies with $1 billion or more in total discretionary spending. This would yield about $15 billion to support SOIL in growing and connecting new TREEs in a vastly widened set of mission spaces.
The risk is the opportunity cost of this budget reallocation to each funding agency. It is worth noting, though, that changes of 0.1–1.0% are less than the amount that the average agency sees as annual perturbations in its budget. Moreover, redirecting these funds may well be worth the opportunity cost, especially as an investment in solving the compounding problems that federal agencies face. By redirecting this small fraction of funds, we can keep agency operations 99–99.9% as effective while simultaneously creating a robust, interconnected, solutions-oriented R&D system.