
Housing in Three Cities Reveals Uneven Heat Death Risk, Despite Air Conditioning
The Federation of American Scientists (FAS) and Groundswell partnered to model how expanding access to residential air conditioning (AC) could reduce heat-attributable deaths and adult emergency department (ED) visits across Greater Boston, Minneapolis–St. Paul, and Greater Houston from 2026 through 2030. The analysis estimates health outcomes and separate financial measures under low, medium, and high AC assumptions for the protective effect of AC, using local geospatial data to identify where cooling gaps and health burdens overlap. Under our primary scenario, Greater Boston has the largest AC policy opportunity, with the widest cooling gap and the largest modeled reductions in deaths and ED visits. Results show that heat exposure, cooling access, and health outcomes interact differently from place to place.
The report recommends three complementary policy actions. Policymakers can upgrade existing homes through financial and technical assistance that makes them easier and more affordable to cool. They can establish a right to cooling through rental standards, indoor temperature protections, and clear authority for residents to make upgrades. They can also create a heat-resilient housing supply through stronger building and energy codes for new homes.
Heat exposure or health data alone cannot tell the full picture of where future heat risk will concentrate. Climate, baseline health, housing conditions, renter status, cooling access, and affordability need to be analyzed together. Yet comparable public data remain fragmented and often use mismatched definitions and geographies. Expanding this approach will require better local data and common standards so communities can compare places, design targeted programs, and measure results.
Key findings
- Heat exposure alone does not determine the AC policy opportunity. Houston has the greatest heat exposure, but widespread AC leaves only 1.7% of households without it. Boston’s much larger cooling gap corresponds to the largest modeled reductions under our primary scenario.
- Similar AC coverage does not imply similar health outcomes. AC coverage differs by only 2.4 percentage points between Boston and Minneapolis, yet Minneapolis has 36% fewer modeled avoidable deaths and 69% fewer avoidable adult ED visits. Baseline health risks and other local conditions matter.
- Local context informs where interventions are needed most. Roxbury contains about 9% of the population in Boston’s neighborhood analysis, but 15% of estimated households without AC and nearly 17% of modeled avoidable health impacts. Its 74% renter share adds an important housing constraint that the metro average cannot show.
In 2023 alone, more than 2,300 people died in the United States directly from extreme heat, and it’s likely this number is an undercount. Beyond mortality, heat-related illnesses and heat’s exacerbation of chronic disease affect people’s overall wellbeing.
Heat vulnerability indices (HVI) model heat-health risks at a spatial level to identify those most at-risk for heat and where they might be living within their jurisdictions. HVIs use social and demographic vulnerability associated with increased heat exposure and worse heat-related health outcomes. But variables related to housing are often left out of these indices. Factors such as renting versus home ownership and air conditioning (AC) access can lead to great variability in indoor heat exposure within communities. For example, while older adults may be more vulnerable to extreme heat generally, there is a vast difference in risk for an older adult with access to a working air-conditioner versus one who does not. Housing factors are much easier to target for intervention than social or demographic factors and are a promising source of rapid returns for policy solutions.
From a policy perspective, HVIs can be limited in terms of their practical applicability to localized decision-making. Often created by public health practitioners, HVIs lack the economic data necessary for policymakers to make informed decisions related to the costs of action versus inaction. There is a strong demand signal for cost-benefit analysis methodologies for heat interventions from the state and local heat policy community.
Our investigation looked at the climate-driven health impacts from housing vulnerabilities as well as their economic impacts. The following report presents key findings from modeling across Greater Boston, Greater Houston, and Minneapolis-St. Paul, and policy recommendations. Beyond policy, our findings and recommendations can be beneficial for housing officials, public health leaders, and the broader climate and healthcare ecosystems.
Methods
We used Groundswell’s geospatial modeling to estimate heat-attributable mortality and adult emergency department visits from 2026 through 2030. The analysis covers Greater Boston, Greater Houston, and Minneapolis-St. Paul at a local scale. The approach applies published research and health risk methods to local climate, population, housing, and AC data on a common sub-kilometer grid. All datasets use the most recent available data that exclude COVID-19 years as structural outliers. Research by Gasparrini et al. and Sun et al. informed the health risk methods. We test low, medium, and high assumptions for the protective effect of AC and use the medium case as a central benchmark.
Mortality baselines use metro rates, while ED baselines use state adult rates because comparable metro ED data were unavailable. This assumes that each metro follows its state adult ED rate and holds other demographic and healthcare conditions constant. Household and neighborhood figures remain approximate and sensitivity cases test plausible assumptions rather than assign probabilities. Installed AC also does not measure equipment performance, building fit, or affordability, so the full-AC case is a comparison rather than a prediction. Appendix A documents the sources and assumptions, while better public data and common reporting standards would make future estimates more precise, comparable, and easier to update.
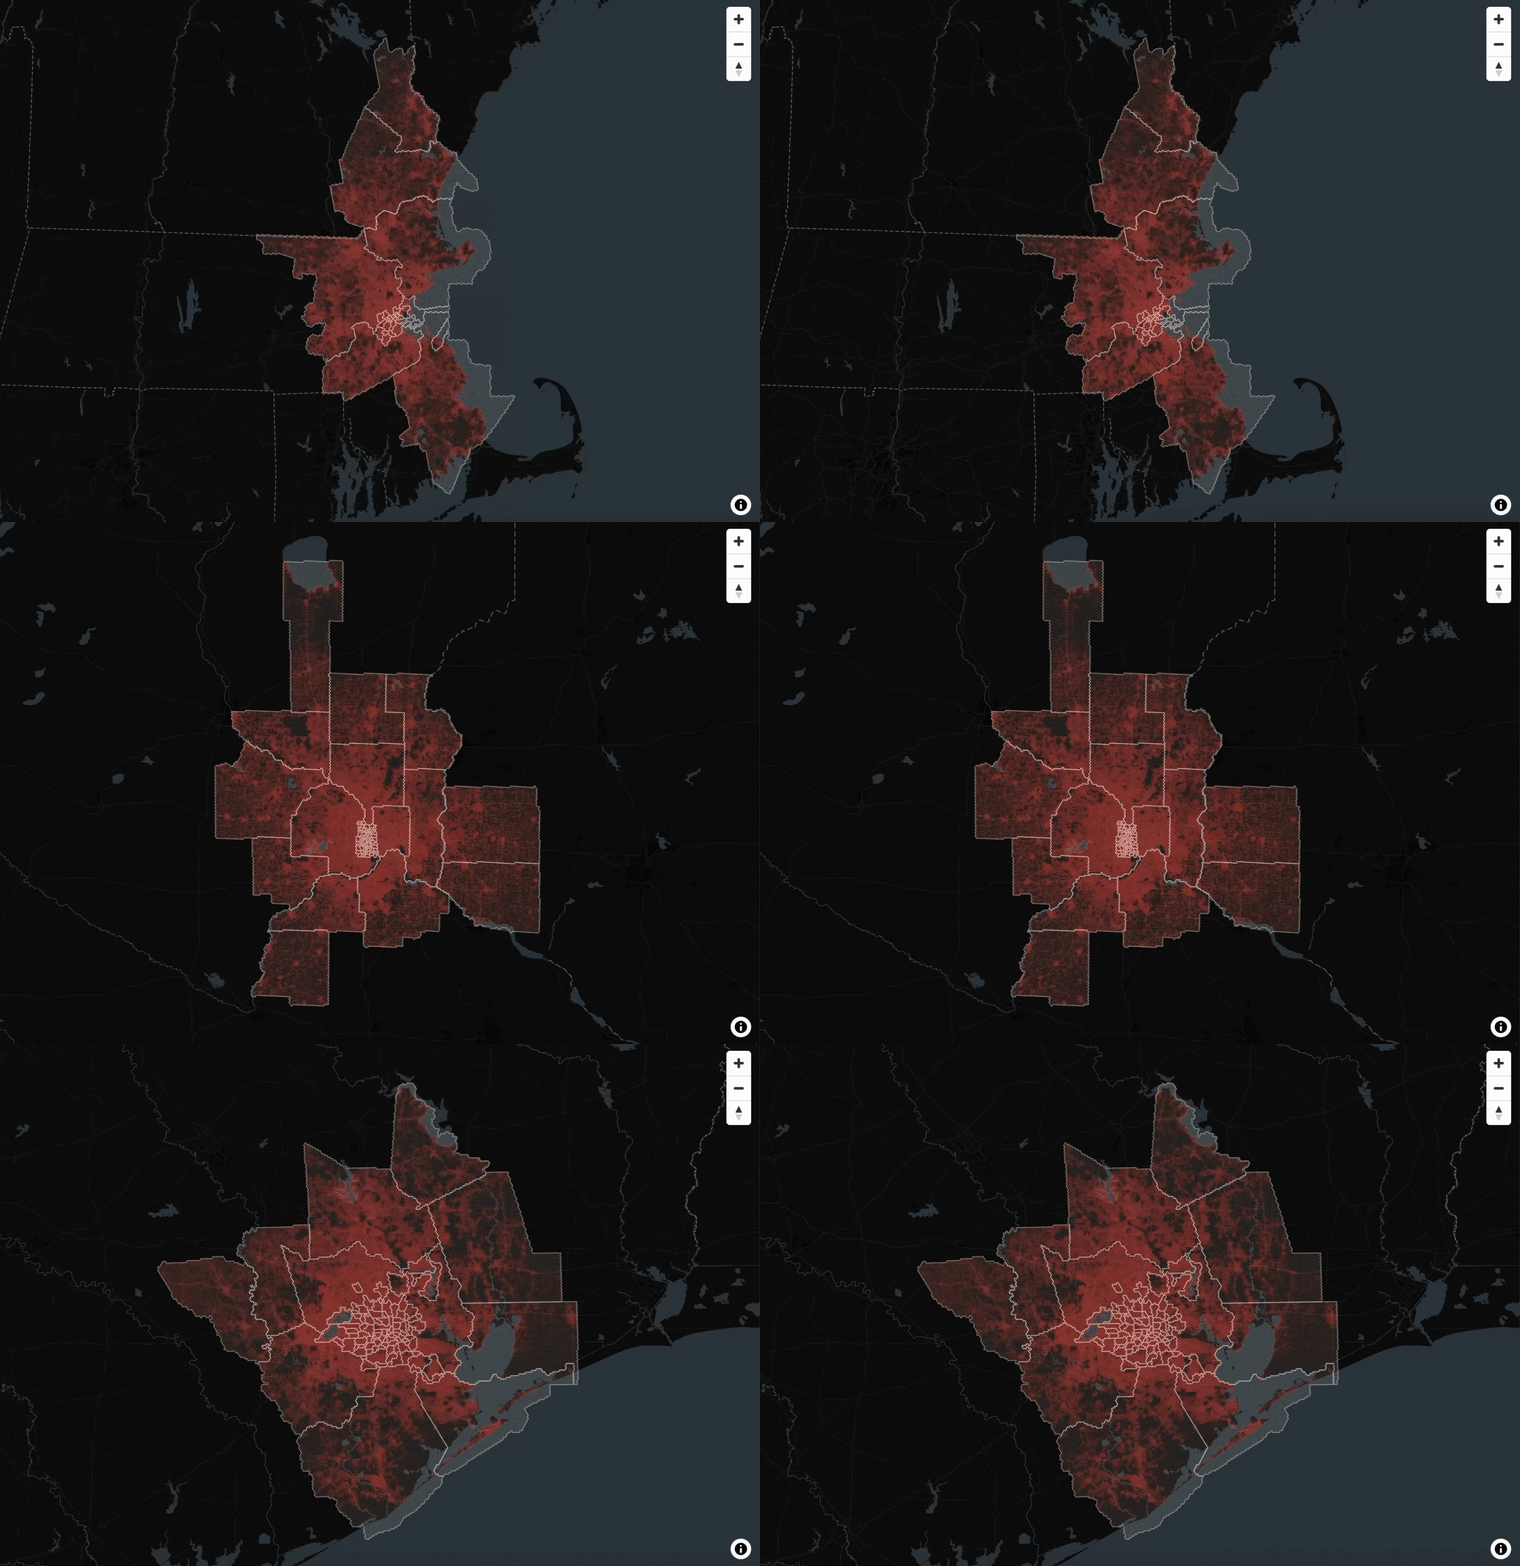
Analysis and Findings
Residential air conditioning is health infrastructure. During periods of extreme heat, access to cooling can change the health risks people face inside their homes. The value of that protection depends on local conditions: how hot a city gets, what its housing is like, the health of its population, and how widely AC is already installed.
Our results show these factors combining differently across Greater Boston, Greater Houston, and Minneapolis-St. Paul. Greater Boston has the largest cooling gap and the largest modeled reductions in deaths and emergency department visits. Minneapolis shows that mortality and emergency department burdens do not always move in parallel. Houston is hotter than either city, yet widespread AC leaves far fewer households without protection. Our findings suggest that heat-resilient housing cannot be understood as a single intervention applied uniformly across cities. Its value depends on the climate, buildings, health patterns, and adaptive capacity already present in each place.
Boston’s results are driven first by the size of its cooling gap. An estimated 196,000 households across Greater Boston lack AC, more than the number in Minneapolis-St. Paul and Greater Houston combined. Under our primary scenario, expanding AC access corresponds to 108 modeled avoidable deaths and 18,500 avoidable adult emergency department visits over five years, the largest totals in the analysis. The City of Boston’s housing report finds that half of occupied housing was built before 1940, and Massachusetts Housing × Heat guidance notes that New England homes were historically designed to retain heat. In other words, expanding access to cooling will likely require different interventions across the region, such as insulation or weatherization upgrades to provide reliable and affordable protection.
Minneapolis-St. Paul is evidence against treating mortality and emergency department visits as a single measure of heat risk. Under our primary scenario, expanding AC access corresponds to 69 modeled avoidable deaths and 5,740 avoidable adult ED visits through 2030. Compared with Boston, that is 36% fewer deaths but 69% fewer ED visits. Minnesota’s lower baseline adult ED rate helps explain the wider difference in acute-care use. But the larger point is that local heat risk can look very different depending on the health outcome being measured.
Houston’s results show adaptation efforts already in action. An estimated 45,700 households across Greater Houston lack AC, about 1.7% of the region’s occupied households. Under our primary scenario, expanding AC access corresponds to 22 modeled avoidable deaths and 3,910 avoidable adult emergency department visits through 2030. The city’s Climate Impact Assessment documents a growing number of days above 100°F and more nights that remain dangerously warm. Houston has the greatest overall heat exposure, but the lowest mortality risk, and our findings demonstrate the role high AC coverage plays in that.
Cooling access and health risk in Roxbury
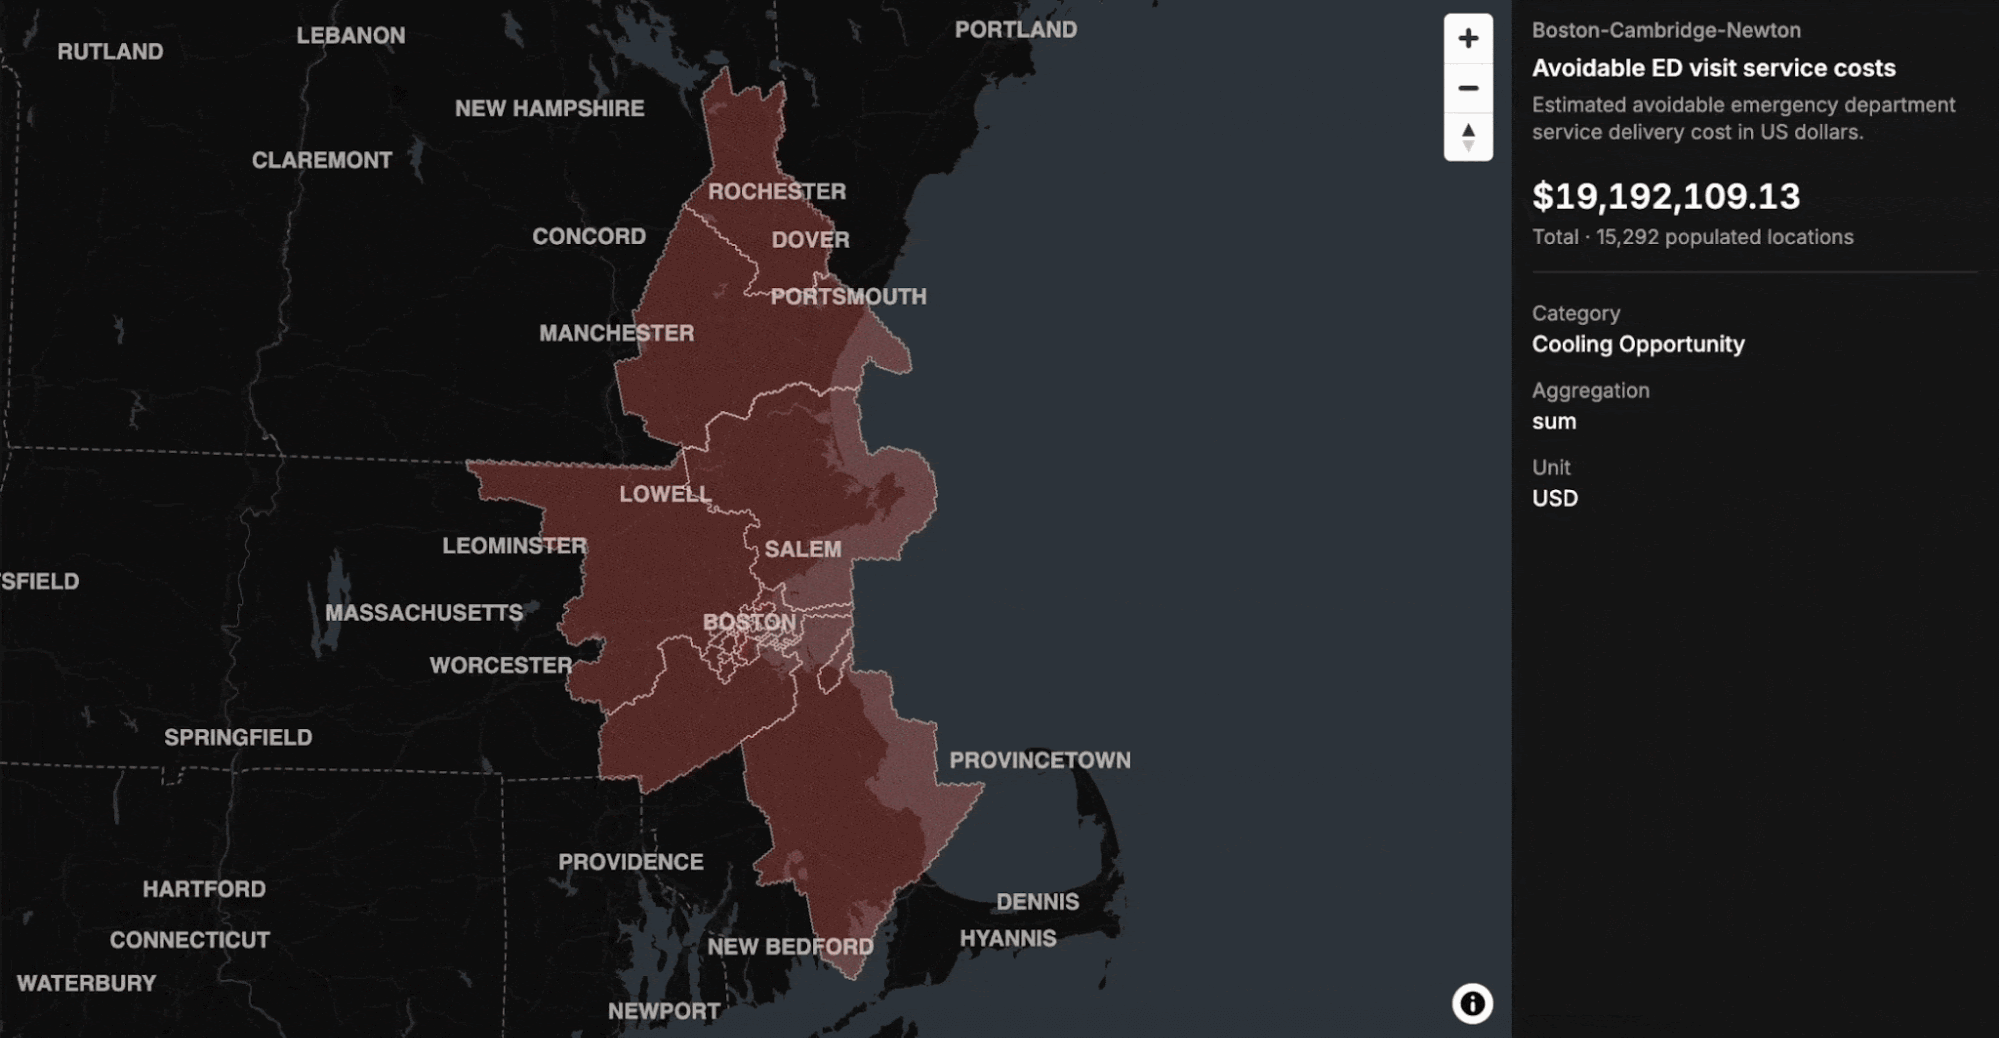
Within the City of Boston, Roxbury presents an interesting case for further inspection. The neighborhood of Roxbury does not have Boston’s largest absolute modeled burden; Dorchester ranks slightly higher. But in Roxbury, renter occupancy, the cooling gap, and modeled health impacts overlap more sharply. Our approximate whole-grid-cell estimates indicate that 74% of occupied households are renter-occupied and 68% lack AC, which is important because renters often depend on property owners to install, maintain, or replace cooling and make related building upgrades. Roxbury contains about 9% of the population, but 15% of estimated households without AC and nearly 17% of modeled avoidable deaths and adult ED visits.
Under our primary scenario, full AC coverage corresponds to approximately 10 modeled avoidable deaths and 1,730 avoidable adult ED visits in Roxbury through 2030. Those outcomes correspond separately to avoided $136 million in mortality losses, $1.3 million in ED service costs, and $8 million in billed charges. It’s clear that local data and context can enable better justifications for initiatives, and build more targeted solutions for the people that need them. In the case of Roxbury, policymakers could use local data to support budget allocation, inform renter protection policies, or create financial support vehicles for housing upgrades.
Implications Beyond Healthcare
Our model captures only a small portion of what inadequate cooling costs families and local economies. It counts modeled avoidable deaths and adult emergency department visits, but it does not account for hospitalizations, ambulance transportation, primary care visits, follow-up treatment, or prescription costs. It also excludes insurance deductibles, copayments, employment hours lost, and other costs paid directly by households.
Many of the omitted effects also occur far from hospitals or clinics. Excessive indoor heat can disrupt sleep and make it harder to work, study, or care for other people. Extreme heat can also reduce hours worked in climate-exposed industries, putting hourly workers’ earnings at risk. Employers bear the effects through absences, reduced concentration, and lower productivity, while local economies can lose labor, business activity, and tax revenues. Heat can also interfere with learning, while overheated homes make it harder to complete schoolwork. Caregivers face added pressure when older adults, young children, or people with chronic conditions cannot safely remain at home.
These burdens are also likely to be uneven. Renters have less authority to alter their homes, and low-income households may be unable to pay for AC units, an electrical upgrade, or the energy to use it. Installing equipment without addressing electricity costs can create nominal access without effective protection, and a household that limits AC use to avoid unaffordable bills is still exposed.
State and local partners can track missed work, household medical spending, school disruption, ambulance use, hospital admissions, and changes in electricity burden alongside emergency department visits and mortality. Healthcare systems and insurers also have a stake in identifying avoidable utilization and helping to fund targeted prevention.
Recommendations
Effective policies are needed to reach the most vulnerable households with cooling solutions. Safe Homes, which includes access to air conditioning and passive cooling strategies, is a top priority in FAS’ State & Local Heat Policy Agenda. Policymakers at the local and state levels can consider the following three strategies to reduce housing-related heat vulnerability and resulting health impacts:
Recommendation 1. Upgrade existing homes for extreme heat (make homes easier to cool).
Policymakers can offer financial and technical assistance so that every household that wants to can upgrade their homes. Actions include: (1) offering grants, tax credits, loans, and rebates for mechanical cooling devices and passive cooling technologies like cool roofs, (2) developing inclusive utility investment programs that allow people to pay for upgrades through utility bills, and (3) standing up navigator programs to access all eligible funding. Some new financial assistance mechanisms, like loans, tax credits, and grants, will need upfront capital to kick-start the program. This ranges from $1,000 tax credits for heat pumps to $35,000 grant programs to replace aging manufactured housing.
Recommendation 2. Establish the right to cooling (get cooling into more homes).
Policymakers can ensure that every household has guaranteed access to effective cooling. Actions that can be taken to implement this recommendation include (1) requiring working cooling systems in rental housing, (2) setting locally-relevant maximum indoor temperature thresholds, and (3) allowing renters and homeowners to make upgrades to their homes for cooling. The costs of these policy recommendations come largely from enforcement, which includes costs to hire new housing inspectors. Some of these enforcement costs can be covered by fines on non-compliant landlords, an action taken by L.A. County to enforce their rule.
Recommendation 3. Create a heat-resilient housing supply (make heat-resilient homes affordable to all).
Policymakers can ensure new homes are built to stay cool during extreme temperatures. Actions that can be taken to implement this recommendation include: (1) adopting and enforcing the most heat-protective building and energy model codes and (2) incentivizing stretch/reach codes. The costs of code development comes from hiring staff with specialized expertise. The costs of code enforcement comes from hiring new code enforcement officers. Finally, the costs of incentives for voluntary adoption of stretch/reach codes can vary, from financial incentives like tax credits to land incentives like transfer of city or state owned land for housing to development incentives like expedited permitting and development bonuses that may require additional staff to process.
All three recommendations should be guided and augmented by hyperlocal evidence. Granular data that brings together heat exposure, housing conditions, cooling access, and health burden can help policymakers determine where to act first, select the right interventions, and track whether resources reach the residents that need them.
Conclusion
This pilot shows that the potential health value of heat-resilient housing can be quantified in terms policymakers and funders can use, and at the scale where impacts actually happen. Across the three cities, the opportunity associated with expanding AC in homes depends on how heat exposure, baseline health, housing conditions, and cooling access interact. Greater Boston’s wide cooling gap corresponds to the largest total modeled reductions, Minneapolis shows that similar AC coverage does not imply similar health outcomes, and Houston shows how widespread adaptation narrows the unprotected population despite greater heat exposure. The Roxbury neighborhood in the City of Boston informs how renter occupancy, cooling access, and health burdens can concentrate more sharply within a city. By reporting mortality value, ED service costs, and billed charges separately, the analysis creates practical benchmarks for assessing program costs without treating modeled outcomes as guaranteed returns.
Next steps
- Expand the approach. Apply local geospatial modeling to more cities with different climates, housing stocks, and cooling needs.
- Refine the evidence. Add better local data on cooling use, building conditions, energy burden, program costs, and additional health and economic outcomes.
- Move toward implementation. Work with public agencies, healthcare systems, insurers, utilities, and community organizations to design targeted pilots and measure their results.
This pilot is a starting point for using local data to strengthen heat-resilient housing policy. Heat, health, housing, and cooling data become more useful when analyzed together and measured consistently across places. With better data and partnerships, communities can identify where investment can do the most good, test programs, and measure results.
Appendix A. Data tables
Better data on working AC infrastructure in American homes would improve how the federal government and its state and local partners target local social services and interventions during extreme heat events.
Addressing rising heat will take all of us. Together, we can create heat-safe homes, workplaces, schools, childcare facilities, and communities – the backbone of a heat-ready nation.