Tracking Hyperscale AI Data Center Growth with Satellite Imagery
The advancement of AI is inextricably linked to its physical foundations. Hyperscale data centers power the world’s most advanced AI models, and the demand for these facilities continues to accelerate. Governments and frontier AI developers alike are investing tens to hundreds of billions of dollars into hyperscale data center buildouts, sparking debates on the economic, environmental, and geostrategic impacts of such efforts. On the international stage, AI is increasingly considered a source of economic growth and an asset to military capabilities, resulting in global competition, particularly between the U.S. and China. In addition, the successful operation of data center facilities requires high quantities of energy, affecting local communities and the environment. Therefore, from grassroots community impacts to global geopolitical dynamics, understanding developing data center capacities is emerging as a critical analytical challenge.
The speed at which AI models are advancing necessitates the rapid growth of its supporting data center infrastructure. In tracking data center construction and operation, what can remote sensing—particularly, the use of electro-optical (EO) satellite imagery—meaningfully illustrate about data center development, and what can policymakers learn from this data moving forward? While multiple research organizations have utilized satellite imagery to track construction and ongoing activity at hyperscale data center facilities, no baseline assessment of its benefits and limitations is available in the public sphere. This research addresses that gap with two case studies: Khazna’s Ajman data center facility in the United Arab Emirates (UAE) and xAI’s Colossus data center site in Memphis, Tennessee. These examples reveal inconsistencies between commercial announcements and on-the-ground activity visible in satellite imagery, showing that official construction timelines, infrastructure permits, and company publications cannot be relied upon exclusively for insights into data center development. Satellite imagery provides a layer of independent verification that can be integrated to overall assessments of data centers, and this study illuminates where this imagery adds insight to inform future AI policy efforts. In particular, as discussions of international AI governance evolve, satellite imagery can be integrated as one verification method in a wider toolkit supporting the monitoring and implementation of future AI-focused agreements.
Acknowledgements
This work draws on Epoch AI’s Frontier Data Centers Hub project—an effort to which the author contributed as a Supervised Program for Alignment Research (SPAR) Fellow—and builds on information originally collected by other members of the project that was further expanded upon for the research. This report was written for and funded by the 2025 GovAI Fall Fellowship.
This report was edited for publication by the Federation of American Scientists, and the author would like to thank Matt Korda and Dr. Oliver Stephenson for their contributions and support in bringing this publication to completion.
Introduction
Data centers are an integral part of the AI ecosystem and impact finance, the environment, and international strategy. The total expected financial investment into data centers spans billions of dollars—and is expected to hit the trillions. The scale of these facilities is also massive: in July 2025, Meta CEO Mark Zuckerberg announced plans for the construction of the Hyperion data center, expected to have a one-gigawatt capacity and cover a land space almost the size of Manhattan. Thus, data centers have significant economic and industrial ramifications as they continue to be developed. The sheer size and scale of these facilities requires high amounts of energy, with these needs driving environmental concerns regarding the overall impact of AI. The Electric Power Research Institute in particular forecasts that data centers will use 9-17% of total U.S. electricity by 2030 (an increase from 4-5% today). In addition, on the international stage, high levels of AI technology have increasingly been seen as a marker for technological supremacy, with countries prioritizing not only the development of AI models themselves but their integration into military systems as national priorities. All of these elements have caused a degree of public backlash regarding data center construction across the globe, reflecting local concerns about energy needs and fears surrounding the unregulated advancement of AI having significant geopolitical destabilizing effects.
Despite this extensive media, political, and analytical attention, public information on data center facilities is often incomplete or opaque, generating uncertainties about their pace of development. In this context, satellite imagery is one tool for monitoring the development and operation of these sites as a form of independent verification. This report thus examines the role satellite imagery can play in tracking data center infrastructure development and operation using electro-optical (EO) imagery and two case studies: Khazna’s Ajman data center in the UAE and xAI’s Colossus data center in Memphis, Tennessee.
The following sections outline an analytical framework, assess observable indicators in satellite imagery, and apply them to these two case studies. The work compares visible features on imagery to commercially announced milestones, informing future forecasting efforts on data center buildout timelines and identifying areas where satellite-derived insights are limited or indeterminate. Recommendations for next steps are included in the conclusion of the report, and outline the role satellite imagery of data centers can play in commercial, government, and local communities. At the international level, discussions of potential multilateral AI governance frameworks are ongoing; satellite imagery is particularly suited to serve as one complementary layer to independently verify commitments under future AI-related agreements.
Comments on Existing Literature
Data center locations are not available in one comprehensive, publicly-available database. Instead, corporations themselves may choose to disclose the locations of their data centers through announcements or publications (i.e. Google’s Data Center directory). Other aggregators such as Data Center Map, Baxtel, and Pacific Northwest National Laboratory’s Open Source Data Center Atlas independently use permits, news articles, and other open source information to collect information and display data center locations. However, the completeness and accuracy of these listings vary. Thus, satellite imagery is one additional layer of independent information that can provide credibility to existing geographical information on data center facilities.
Several organizations have expressed interest in utilizing satellite imagery to track data center construction and operation. Notably, Epoch AI’s Frontier Data Centers Hub uses satellite imagery, permit data, and other open sources to track hyperscale data center buildout within the U.S.. In addition, Semianalysis has a data center analytical model that also relies on satellite imagery to provide commercial and industrial insights on data center activity for private companies. However, the Semianalysis model is not publicly available and is instead sold to companies for forecasting, business intelligence, energy usage, construction tracking, and environmental assessment purposes. Epoch AI’s methodology is publicly available, but does not detail how specifically to analyze the imagery itself, focusing on broader applications for energy usage calculations.
Therefore, while there is a clear interest in this type of analysis, there is still ample space to expand upon the impacts satellite imagery analysis can have in the AI field. This research provides a broad overview of satellite imagery’s capabilities for hyperscale data center tracking, providing an assessment of its benefits and limitations.
Satellite imagery has also long been integrated into media reports as a flashy and attractive visual for news articles, and data center construction is no exception. In October 2025, Business Insider published a high-level article illustrating the growth of U.S.-based data centers on satellite imagery. This displays an appetite in the public sphere for visual representations of data center expansion. Articles such as these lack the detail of traditional imagery analysis, and could benefit from additional context that formal analyses can provide. More generally, satellite imagery data is useful for a variety of stakeholders: governments can use satellite imagery of data centers to inform policy decisions regarding AI-related infrastructure expansion in the face of perceived international competition and strain on electricity grids. Frontier AI labs can integrate imagery assessments to stay informed of the progress of their (and their competitors’) data center development. In addition, the public can harness satellite imagery to increase transparency of local development projects and ensure that companies are adhering to their permit terms and legal obligations. This research in particular addresses the latter, displaying how satellite imagery adds transparency for verification of corporate data center operational activities.
Among researchers, some skepticism remains about the use of satellite imagery to track data center construction. In late 2024, Lennart Heim and Konstantin Pilz argued that satellite imagery of data centers can be limited in its usefulness to track the proliferation of computing power. Their assessment took a conservative view of satellite imagery’s utility, stating that elements such as chip quantity, chip type, and power consumption levels are difficult to extract. While it is true that EO imagery cannot directly observe GPUs or other indoor hardware, this research argues that satellite imagery is valuable for independent verification of visible infrastructure and construction progress, and for making broad data center capacity estimates.
Methodology
For this research, the author first assesses the principles underpinning the analysis of electro-optical (EO) imagery, outlining how it could reveal physical infrastructural patterns at data center facilities. The author then applies these concepts to two case studies: the Ajman Data Center in the UAE (to track buildout and construction) and xAI’s Colossus data center facility in Memphis, Tennessee (to illustrate feature identification). Note that this research focuses primarily on hyperscale data centers (i.e. those with at least 50-100 MW capacity). These types of facilities have a large geographic footprint—often spanning tens to hundreds of football fields—and are easier to visualize in publicly-available EO imagery than medium- to small-scale data centers. These might be housed in existing buildings or urban centers and therefore might not have the clearly-identifiable visual signatures expected at hyperscale data center campuses.
Opportunities and Challenges of Utilizing Satellite Imagery for Data Center Monitoring
Electro-Optical Imagery Basics & Uses
Overview of Electro-Optical (EO) Imagery
Electro-Optical (EO) imagery is satellite imagery that is collected via sensors that detect sunlight signatures in the visible and near-infrared portions of the electromagnetic spectrum. Therefore, depending on the collection parameters and post-processing, finished and published EO imagery products will generally look like a “photograph” from above to the naked eye. EO imagery is widely available commercially, both free of charge and for purchase. Commercial providers such as Airbus, Planet Labs, and Vantor are commonly-used sources of paid satellite imagery, with prices ranging from roughly $15 to several hundreds of dollars per square kilometer, depending on the area of interest, resolution, and provider. Free sources of satellite imagery can be acquired via platforms such as Google Earth Pro, European Space Agency’s Copernicus Sentinel program, and NASA Earthdata/Landsat. This is generally archival imagery or lower-resolution than resources available through paid providers. For more information on satellite imagery analysis basics, see FAS’s prior publication on the topic, A Guide to Satellite Imagery in the Nuclear Age: Assessing China’s CFR-600 Reactor Facility.
The spatial resolution of an image determines its level of granularity and detail. A high-resolution image is considered anything better than one-meter resolution: in other words, the length of each pixel represents one meter.At ten-centimeter resolution, therefore, one pixel represents ten centimeters on a side, corresponding to a 10-centimeter by 10-centimeter ground footprint.
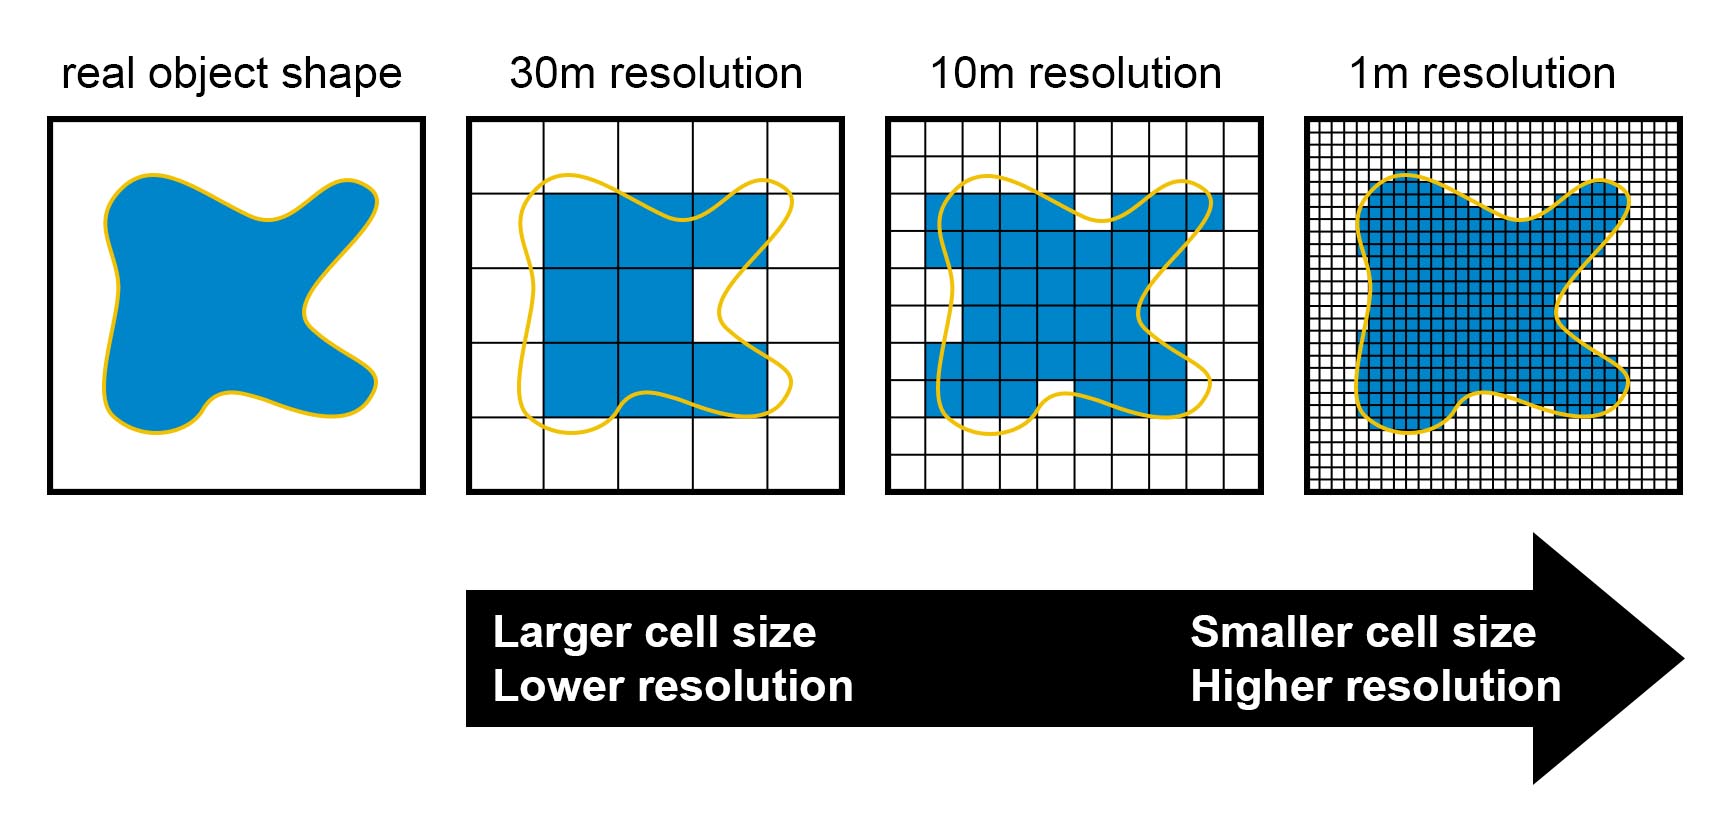
Fig. 1. Comparison of satellite image resolutions at different ground sampling distances. Source: Wikimedia Commons, CC0 Public Domain.
At a typical industrial facility—for example, a nuclear reactor, water treatment plant, or coal processing facility—the following features can be identified in high-resolution satellite imagery:
- The overall footprint of the facility;
- Buildings;
- Security perimeters and entrances;
- Roads;
- Vehicles;
- Terrain changes and construction; and
- Other large-scale infrastructural features.
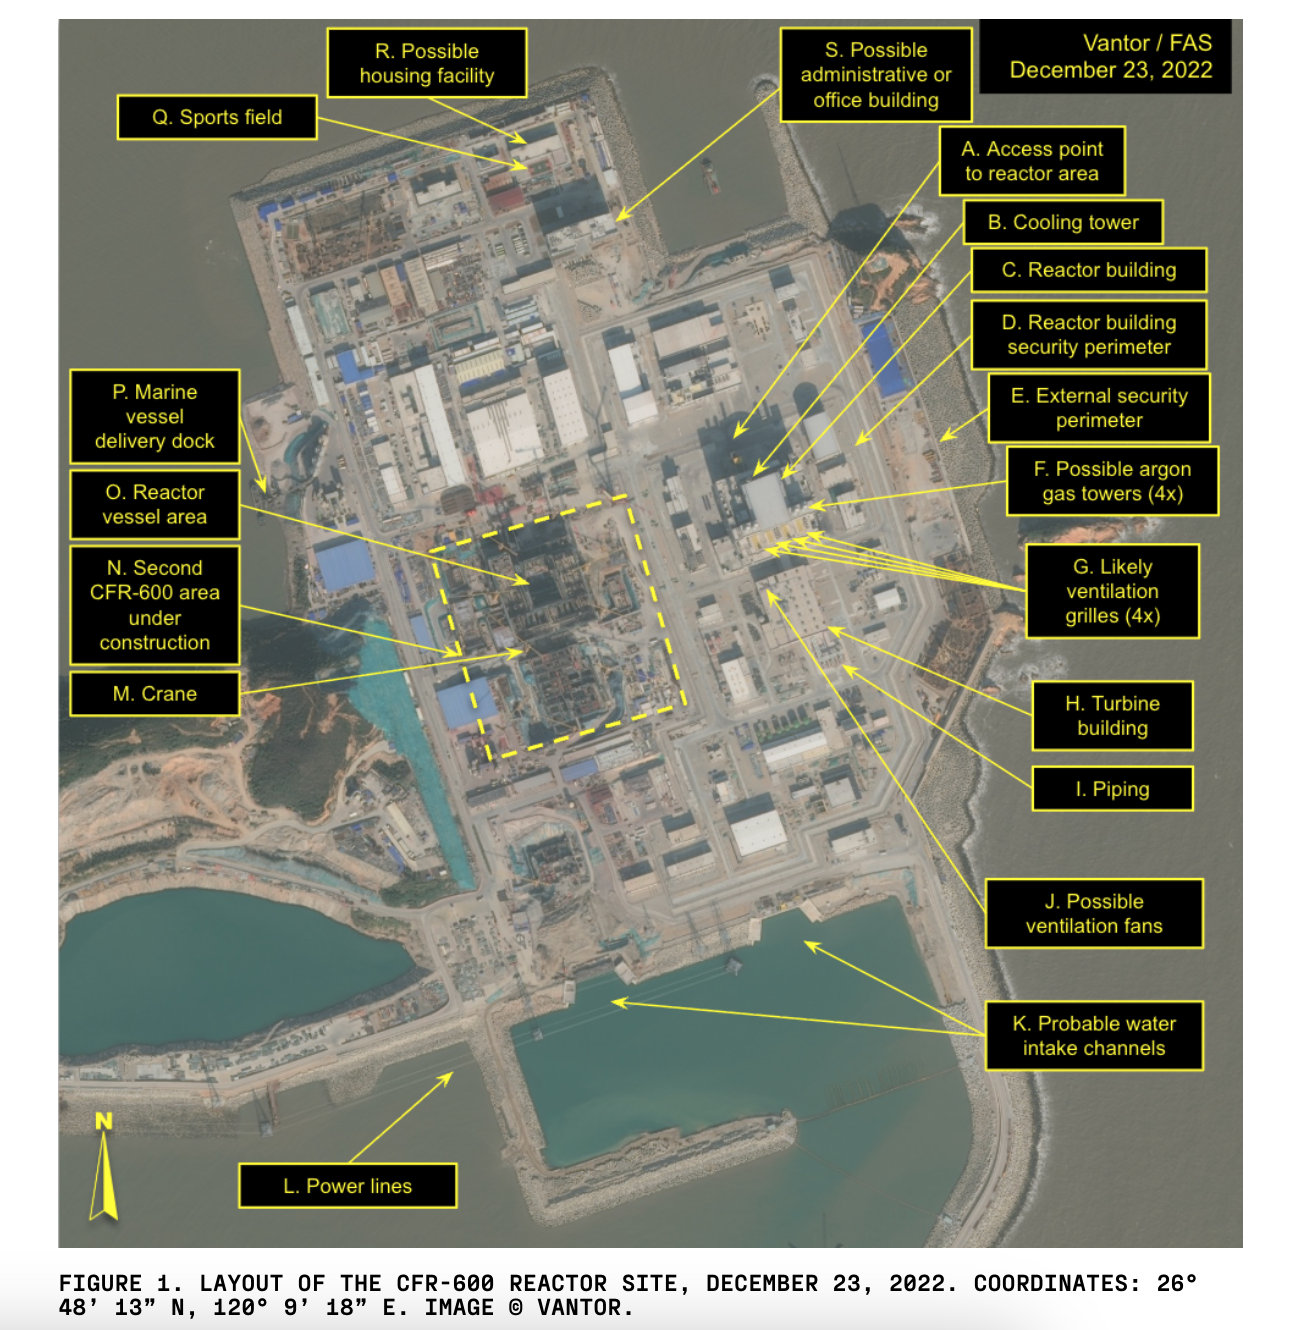
Fig. 2. Example of satellite imagery used to identify features at China’s CFR-600 nuclear reactor facility. Source: A Guide to Satellite Imagery in the Nuclear Age: Assessing China’’s CFR-600 Reactor Facility, Federation of American Scientists, December 2025
Figure 2 shows an example of EO satellite imagery being used to identify infrastructure at a nuclear reactor. Some of these principles can also be applied to monitoring data center development and construction, as discussed in the following sections.
Data Center Applications
Feature Identification
EO imagery can be used to identify specific infrastructural features of interest at a data center facility. The following generalities have been drawn from U.S.-based hyperscale data centers operated by frontier AI developers, and these features can be identified on imagery of at least 50-centimeter resolution. Some features from international facilities have also been included.
While the features outlined below display several visual patterns to make identification on satellite imagery feasible, it is vital to note that these features and their arrangements are highly variable, and the patterns outlined in this section are guidelines rather than strict rules. This is discussed further in the Limitations section below.
Appendix A contains a summary of the key features of a data center, the satellite resolution necessary to resolve them, their distinguishing elements, and potential obstacles.
Main Data Halls
The main building of a hyperscale data center facility houses the equipment used for AI applications, including racks, servers, and chips. These are generally sizable buildings that have a large geographic footprint. On satellite imagery, they appear as the “main” and largest building in an area. The main buildings may have white or pale-colored rooftops for reflectivity and temperature control as well. They also commonly have flat or low-sloped rooftops for ease of installation of HVAC equipment on top.
Fig. 3. Main data hall, du Data Center Silicon Oasis, Dubai, UAE, July 22, 2025. Coordinates: 25°7’58.32″N, 55°23’30.16″E. Image: Google © 2025 Airbus
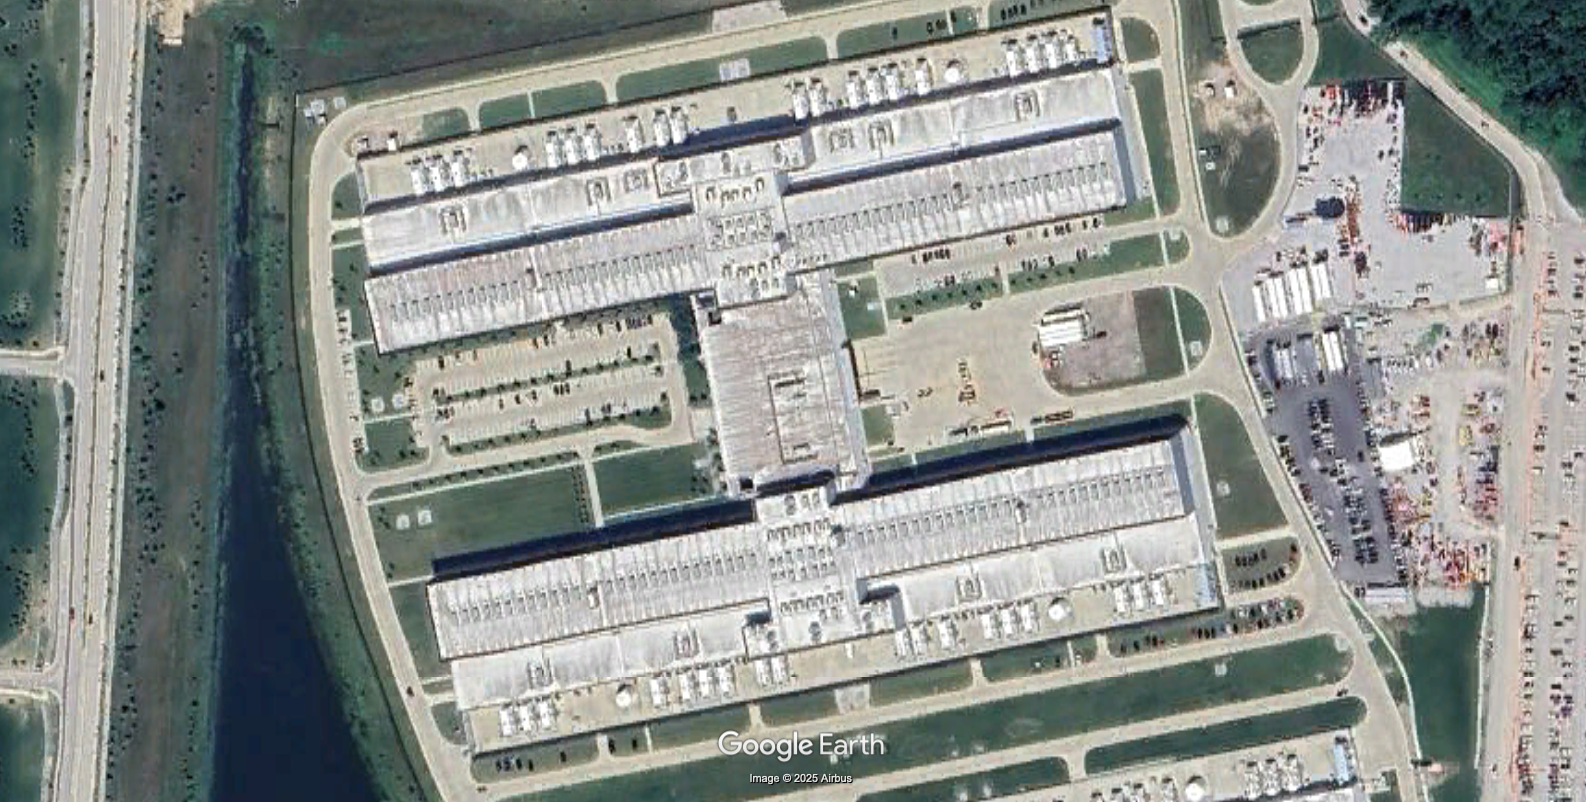
Fig. 4. Meta Prometheus, New Albany, Ohio, U.S.A, July 2, 2025. Coordinates: 40°4’6.24″N, 82°45’1.34″W. Image: Google © 2025 Airbus
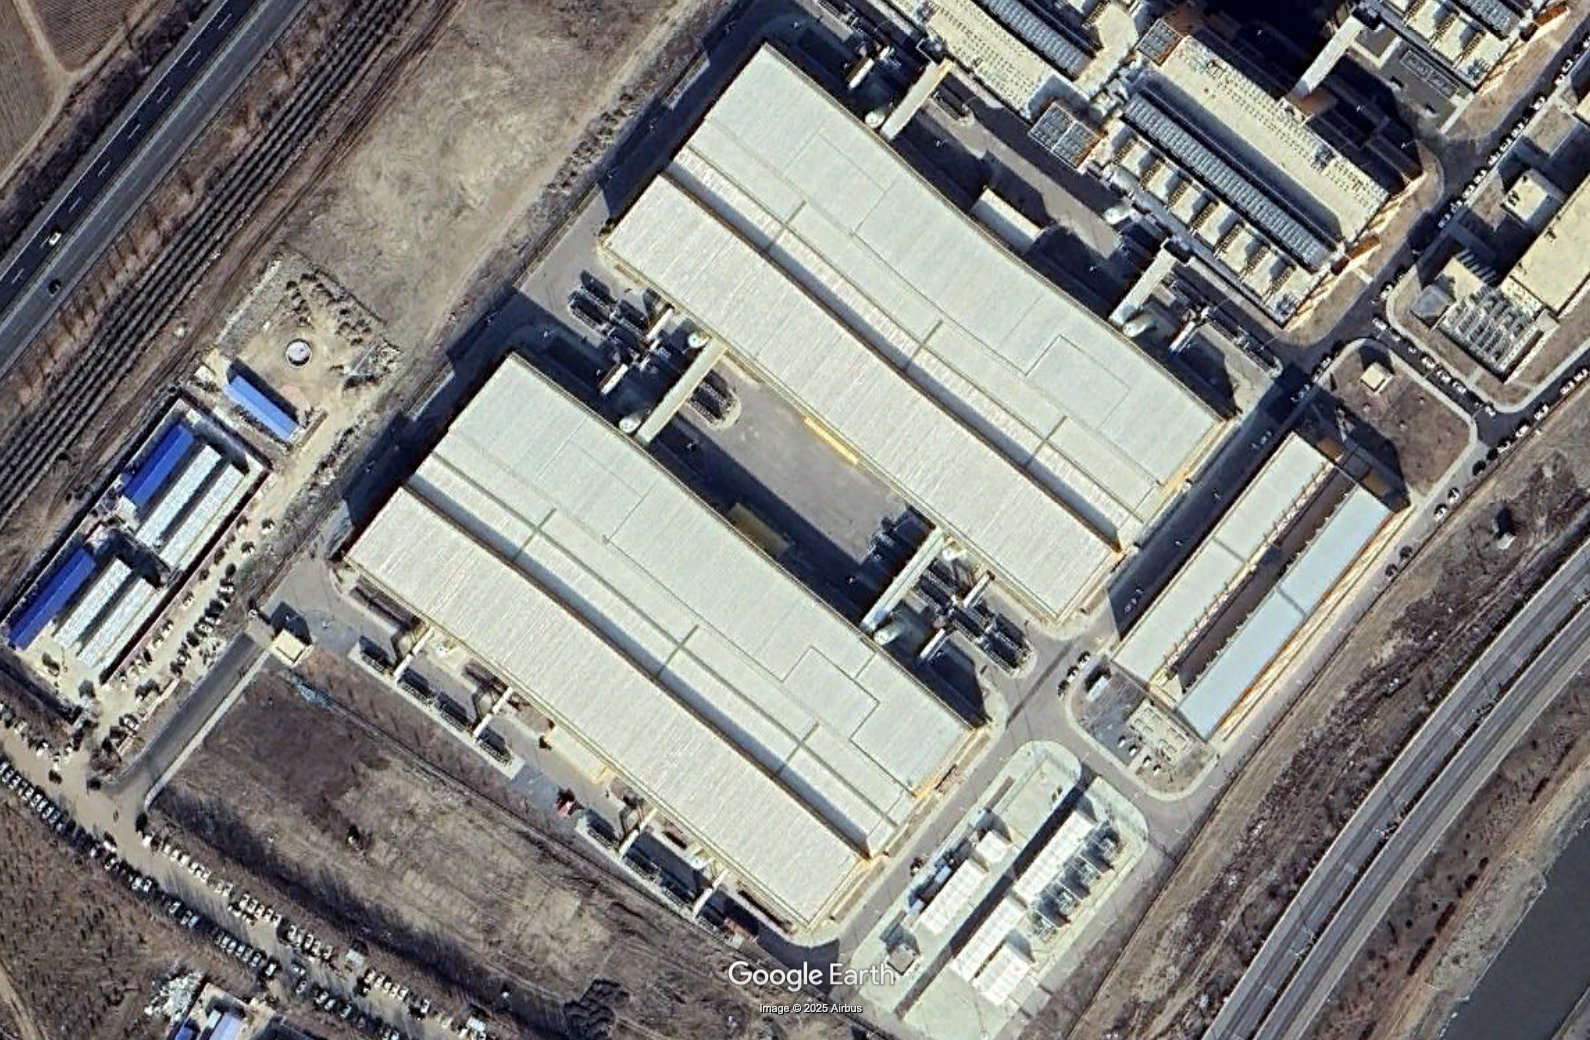
Fig. 5. Alibaba Zhangbei Data Center, Zhangjiakou, China, November 7, 2024. Coordinates: 41°11’34.73″N, 114°41’53.37″E. Image: Google © 2025 Airbus
Data center halls are identifiable both by their size and their surrounding infrastructure (discussed in the following sections). Note that, for a data center site, if a building takes up a similar large footprint but only trucks or loading areas are visible around its edges, it is likely a warehouse instead and not an IT-specific building.
Support/Administrative Buildings
Administration buildings will generally be built closer to an entrance or parking area at a data center site. They will have a much smaller footprint than the main data hall but will be located in its general vicinity.
On-site Grid Power
Substations and switchyards manage grid power for distribution to the rest of the data center facility. Substations—used for voltage transformation and power distribution—are generally distinguishable by the presence of power transformers (see Figure 6). Switchyards, on the other hand, reroute power without changing the voltage, and will generally not have transformers visible. In the U.S., they are generally identifiable by their appearance as open, flat, gray concrete lots with rod- or pipe-like features, thin metal infrastructure, and adjacent blocks. Expected features include steel gantries (frames providing stable support for other equipment), transformers (boxes used for electrical transfer), and busbars (metallic strips used for conduction and energy transfer). Thick cables or rod-like features might be visible connecting a substation to the main data hall, but this is not always necessarily the case, as both overground and underground feed systems could be in use. In addition, in higher-resolution imagery, power lines and their associated towers connecting to the substations could be visible.
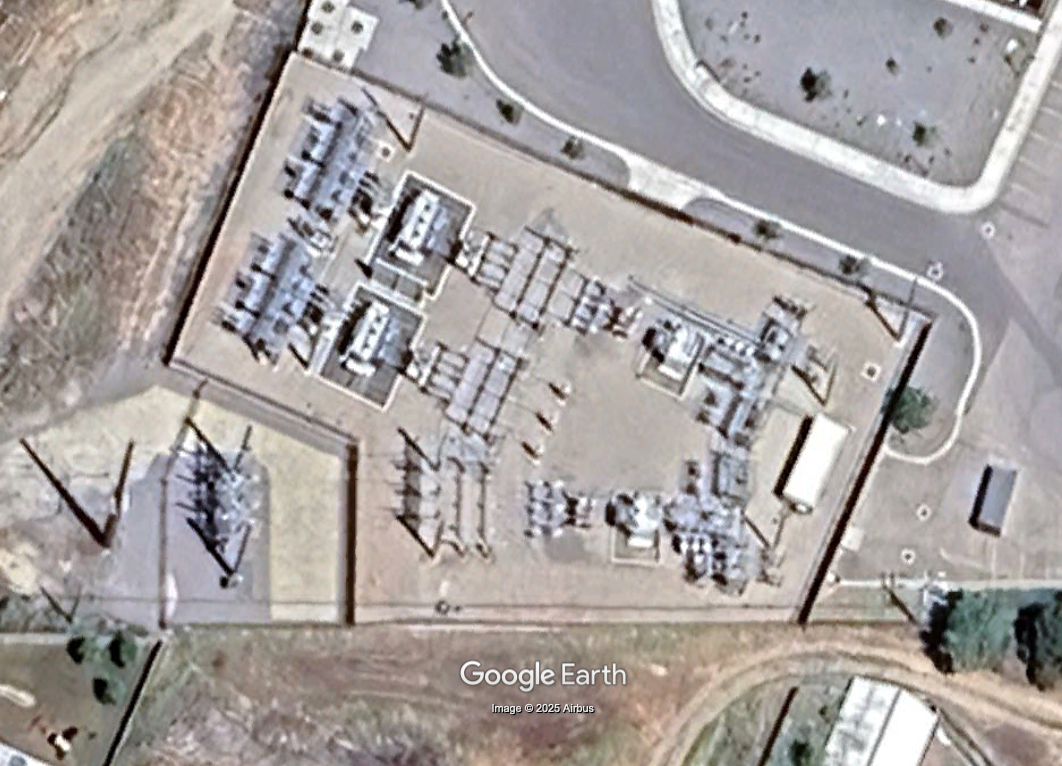
Fig. 6. Granite Point Data Center Campus Substation, Bluffdale, Utah, U.S.A, June 1, 2025. Coordinates: 40°28’45.18″N, 111°54’26.34″W. Image: Google © 2025 Airbus
In some locations, the on-site grid power will be housed within a dedicated building. Indoor substations could indicate that they are gas-insulated switchgear (GIS) substations, medium-voltage (MV) distribution substations with air-cooling systems, indoor transformer halls (housed inside for noise reduction), or a combination of these.This is particularly true for hot and dry countries such as the UAE; substations in these environments could be located indoors for temperature control purposes. Therefore, substations and switchyards will not necessarily look the same at data centers around the world.
Main and Backup Power Generation
Data centers require significant amounts of energy to operate, typically ranging from tens to hundreds of megawatts (MW), with gigawatt (GW)-scale facilities now emerging. The high environmental cost of data center operation has placed them in the spotlight: from grassroots organizations to the United Nations, global communities have raised myriad concerns regarding the strain data center facilities place on electricity systems and water resources.
For hyperscale data center facilities, power generation infrastructure ensures that the main buildings have consistent access to adequate power. Main power generators come in various designs, but are often natural gas turbines (see Figure 7). They will appear larger than backup generators, and will have cylindrical exhaust stacks which appear circular on imagery. However, not all data center facilities will show a main power generation source. In some cases, the power plants supplying energy are offsite and not necessarily visible at the facility itself.
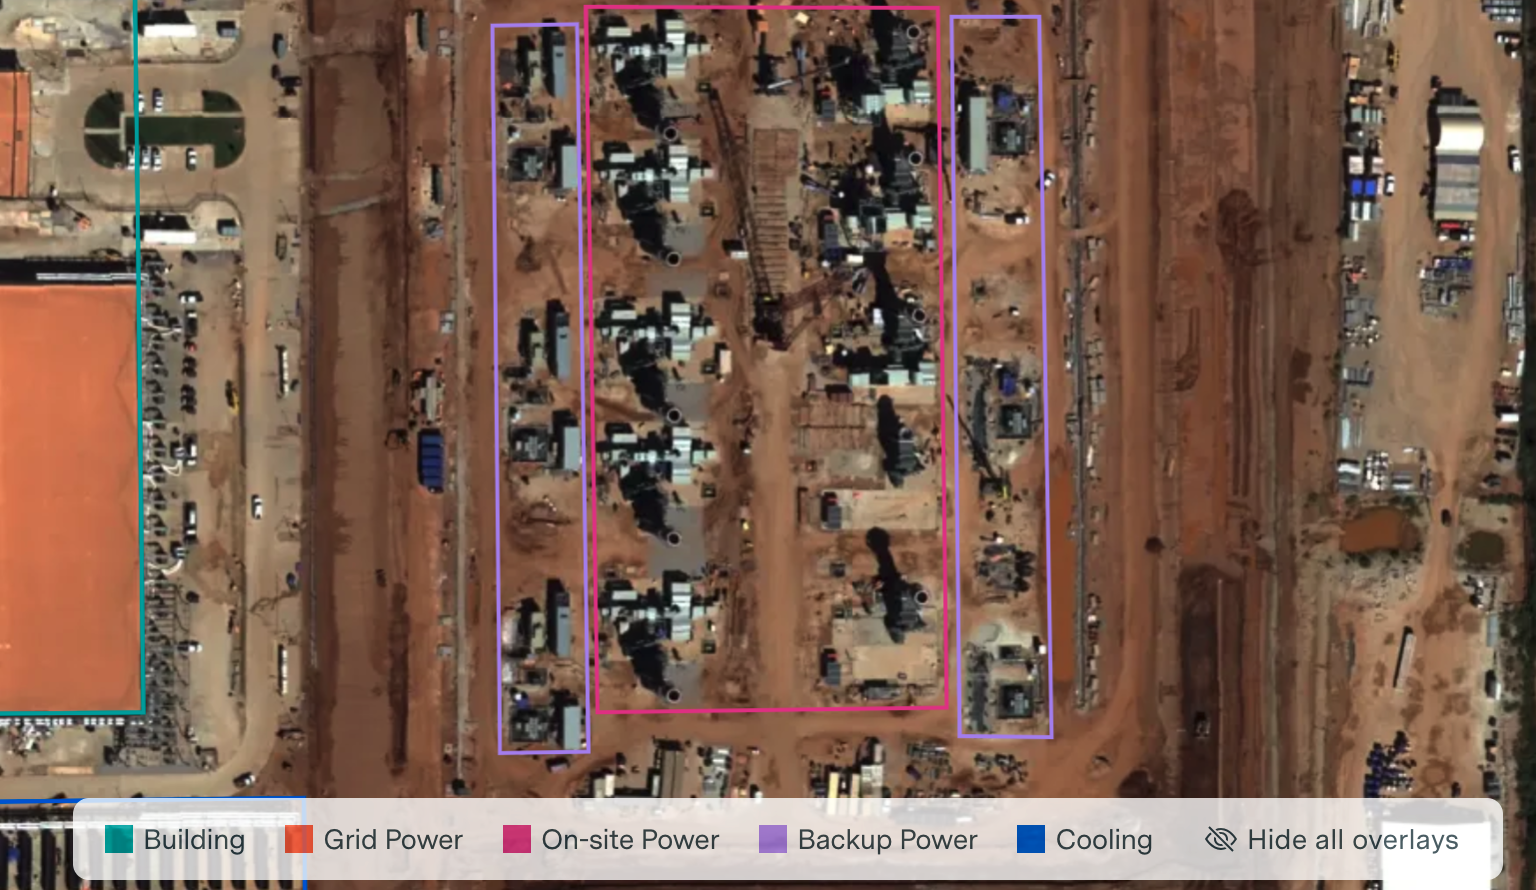
Fig. 7. Screen capture of OpenAI Stargate Abilene facility main power infrastructure outlined in pink within the Epoch AI Satellite Explorer, image dated September 26, 2025. Coordinates: 32°30’16.17″N, 99°46’31.20″W. Image: Epoch AI Satellite Explorer © 2025 Airbus via Apollo Mapping
Backup generators—often diesel—provide emergency power to the main hall if the main power fails. These generators will usually be numerous and in close proximity to the main data hall. They will appear as smaller, thinner rectangles arranged in rows. They will not have fan features (and therefore can be distinguished from cooling infrastructure). Their regular spacing and alignment along the main building perimeters are distinctive. See Figure 8 for an example.
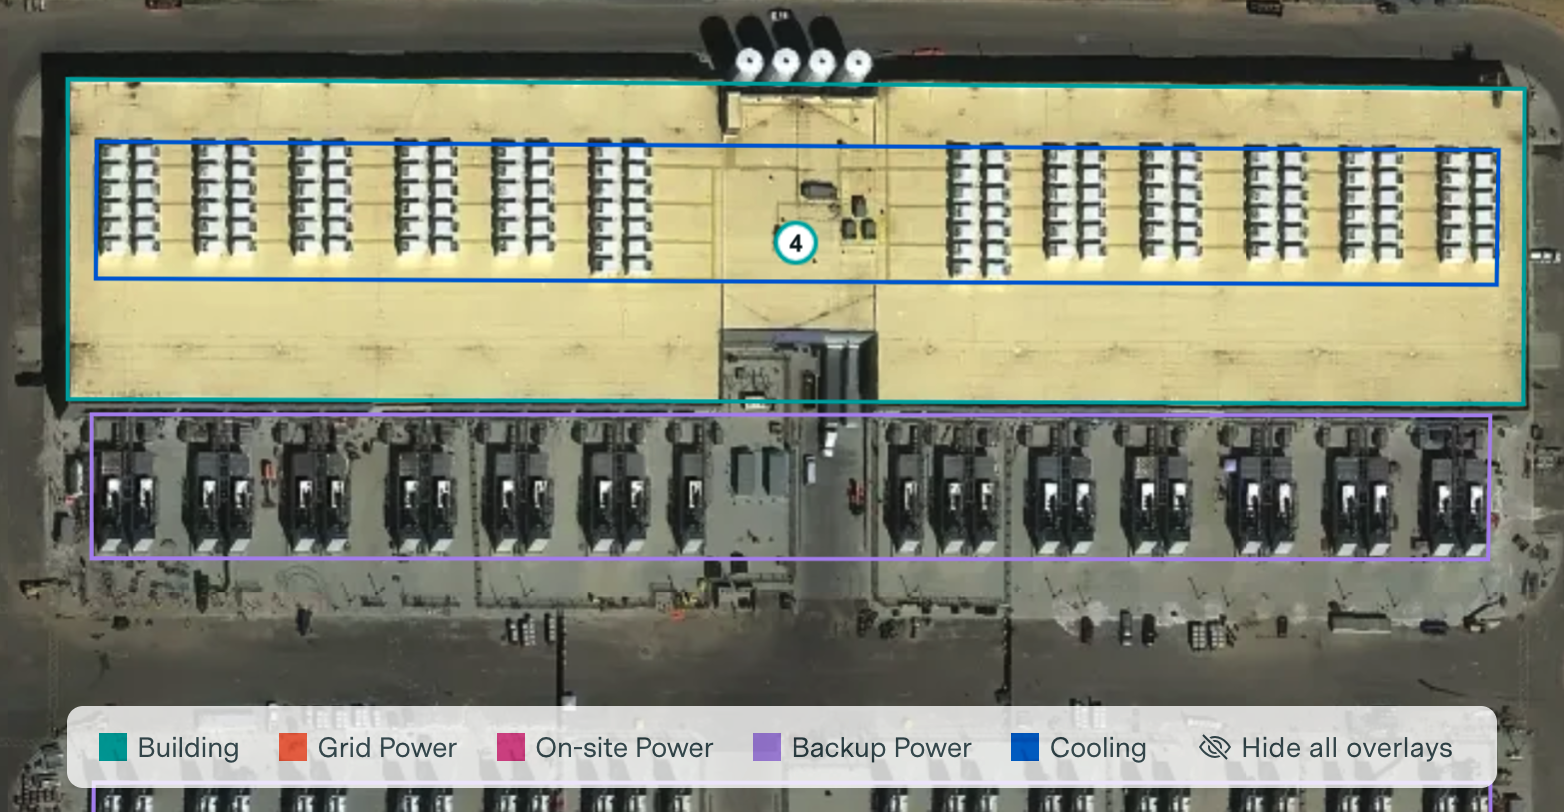
Fig. 8. Screen capture of Amazon Madison Mega Site facility backup power outlined in purple within the Epoch AI Satellite Explorer, image dated October 4, 2025. Coordinates: 32°35’46.34″N, 90°5’40.50″W. Image: Epoch AI Satellite Explorer © 2025 Airbus via Apollo Mapping
Cooling Infrastructure: Chillers and Cooling Towers
Cooling infrastructure is vital for removing heat from data halls. Chillersactively remove heat from the data center cooling loop. Cooling towers are heat-rejection systems used to release heat to the atmosphere. Chillers and coolers will generally be colocated at a data center site; however, not all data centers require both. For example, water-cooled systems typically require cooling towers to release heat, while air-cooled systems do not, instead blowing air at a refrigerant-filled coil for heat dissipation. Cooling towers are distinguishable by their arrangement in rectangular or square clusters with large circular fan openings (see Figure 9). These fans are distinct on high-resolution imagery, spanning several feet in diameter.
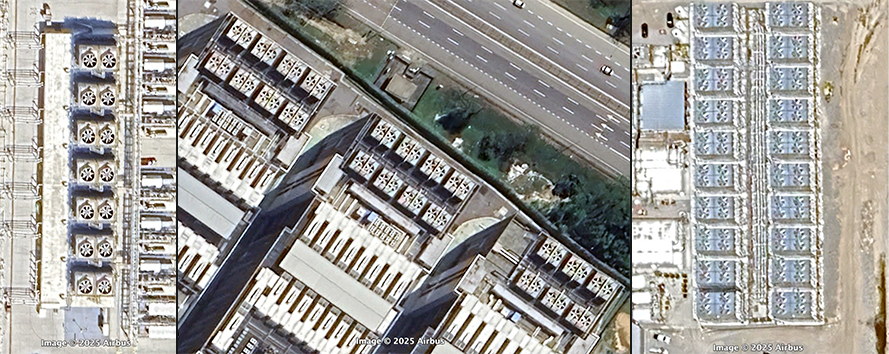
Fig. 9. Examples of cooling towers. Left: Red Oak Google Data Center, Red Oak, Texas, U.S.A, August 24, 2025. Coordinates: 32°32’22.49″N, 96°47’31.47″W. Image: Google © 2025 Airbus
Middle: AirTrunk Iskandar Puteri, Iskandar Puteri, Malaysia, April 29, 2025. Coordinates: 1°26’6.45″N, 103°36’3.43″E. Image: Google © 2025 Airbus
Right: Switch Citadel Campus, Sparks, Nevada, U.S.A, June 19, 2025. Coordinates: 39°32’19.60″N, 119°26’12.77″W. Images © Airbus via Google Earth Pro. Image: Google © 2025 Airbus
Chillers, on the other hand, will usually be boxy or container-like in shape (See Fig. 10). Air-cooled chillers could show smaller circular fans arranged in a grid, but these are smaller in size and generally only distinct in ultra high-resolution imagery (higher than 30-centimeter resolution; see Table A for further details). Water-cooled chillers are generally housed indoors, and therefore would not be visible in EO imagery, but this is not universally the case at every facility.
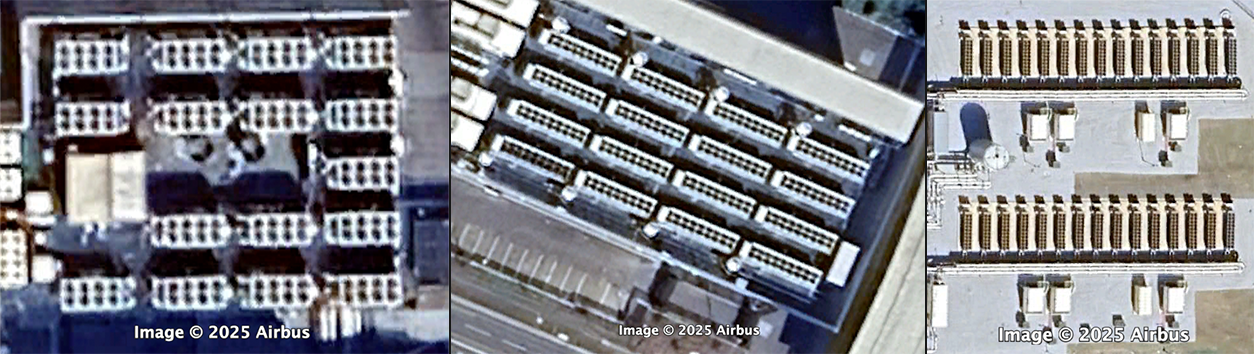
Fig. 10: Examples of chillers. Left: Digital Realty ORD10 / Lakeside Technology Center, Chicago, Illinois, U.S.A, August 7, 2025. Coordinates: 41°51’14.35″N, 87°37’5.70″W. Image: Google © 2025 Airbus
Middle: Equinix LD5, Slough, United Kingdom, August 16, 2025. Coordinates: 51°31’2.18″N, 0°37’0.74″W. Image: Google © 2025 Airbus
Right: QTS Microsoft Fayetteville Data Center, Fayetteville, Georgia, U.S.A, October 31, 2025. Coordinates: 33°27’7.89″N, 84°31’18.58″W. Image: Google © 2025 Airbus
Construction and Change Over Time
Crucially, EO imagery can be used to track the construction of a data center over time. Using several satellite images of a data center collected over the course of months or years, the footprint of land use can be monitored chronologically. EO imagery is well-suited for tracking change over time, as progress is often significant enough to be seen on medium- to high-resolution imagery available publicly. Construction milestones are particularly useful for assessing future buildout: understanding the time required to build a data center can assist in planning for energy needs and estimating energy capacities. Case Study 1, the Ajman Data Center in the United Arab Emirates, is an example of satellite imagery used to track chronological data center expansion.
Case Study 1. Tracking Construction at the Ajman Data Center, UAE
Background & Context
The Ajman Data Center in the United Arab Emirates is one example of ongoing construction of a hyperscale data center facility. In October 2024, Khazna Data Centers—the largest data center construction firm in the Middle East and North Africa—announced plans to build the region’s largest data center facility in Ajman. Official announcements noted that the Ajman Data Center would be the first AI-optimized hyperscale data center facility in the region, with a footprint of 100,000 m2 and 20 data halls, each with 5 MW capacity (bringing the total capacity to 100 MW)., This is a significant achievement for the UAE, illustrating its capacity to manage large-scale AI compute needs, and is of particular interest given the United States Commerce Department’s November 2025 decision to allow the sale of advanced semiconductor chips to the UAE. The development of AI-focused data centers in the region, thus, highlights the potential integration and use of this exported hardware abroad.
Ajman is a well-documented data center facility, and there are several EO satellite images available in open sources capturing its construction over time. Using imagery from Google Earth Engine and Copernicus, this case study tracks the buildout of the Ajman Data Center over the course of 2024-2025, providing a comparison of commercial construction milestone announcements to real-world, on-the-ground data.
Chronological Assessment
Publicly-available imagery illustrates the development of the Ajman Data Center from May 2024 to August 2025. Figure 11, below, shows the milestones visible in satellite imagery in comparison to official commercial announcements by Khazna.
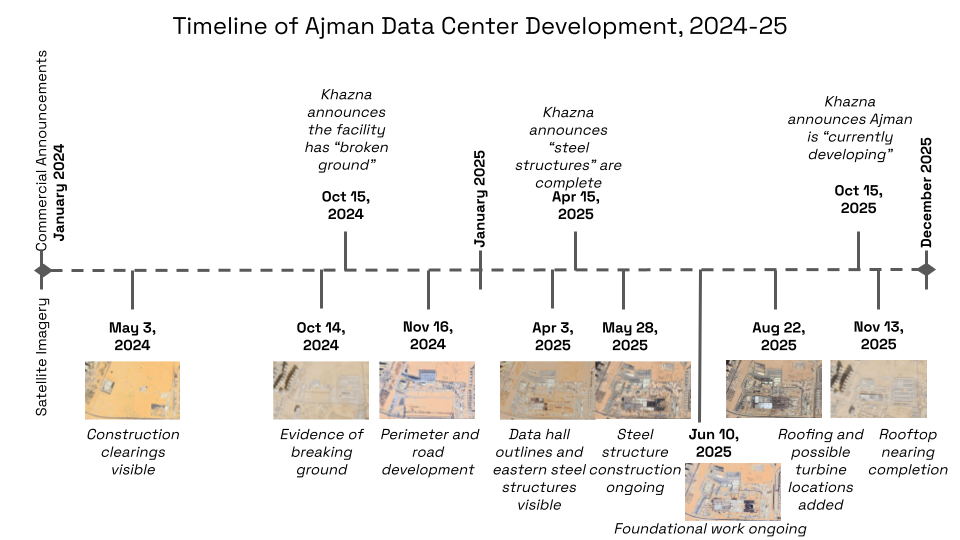
Fig. 11. Timeline of the Ajman Data Center construction compared to Khazna commercial announcements. Images: European Space Agency Copernicus Sentinel Data © 2024 and 2025 / Google © 2024 and 2025 Airbus
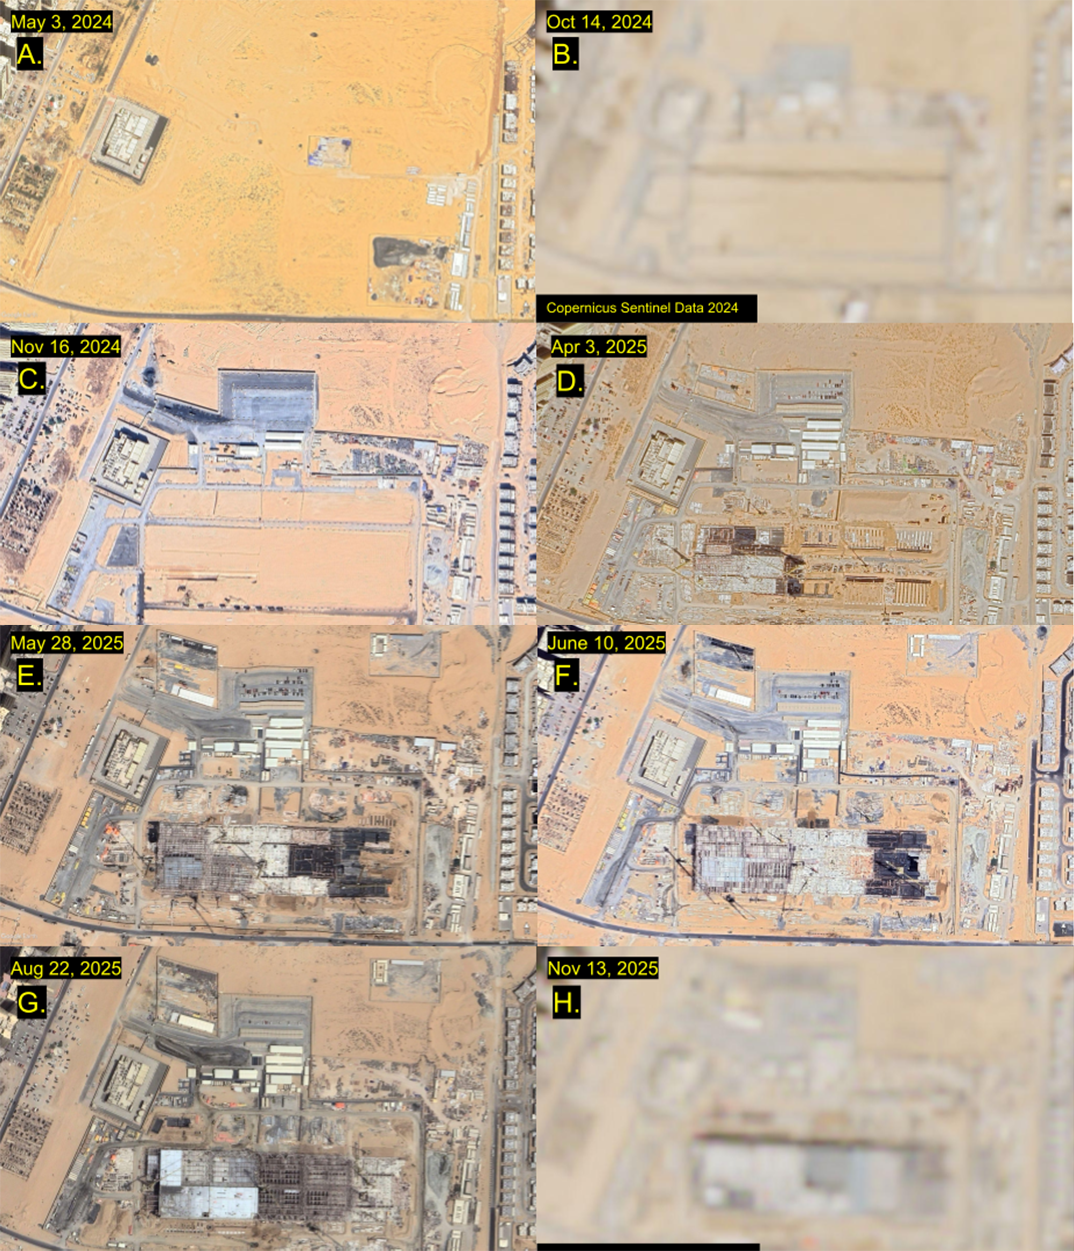
Fig. 12. Progression of construction at the Ajman Data Center. Images B and H © European Space Agency Copernicus Sentinel Data 2024 and 2025. Images A, C, D, E, F, G: Google © 2024 and 2025 Airbus
The above images (Figure 12) illustrate the chronological development at the Khazna Data Center with significant milestones visible. Below is a detailed evaluation of this change over time, image by image, highlighting the significant discrepancies between Khazna’s official announcements and the imagery.
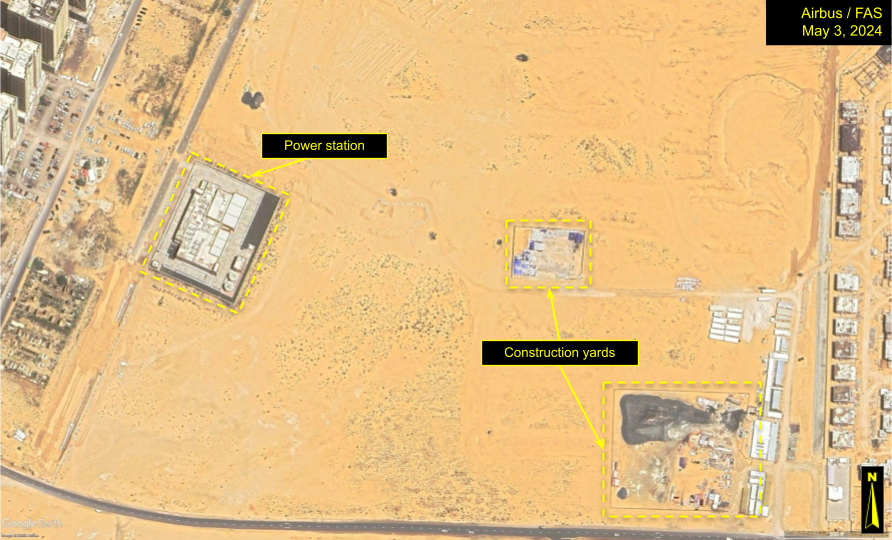
Fig. 13. Ajman Data Center site, May 3, 2024. Coordinates: 25°23’22.57″N, 55°34’44.82″E. Image: Google © 2025 Airbus
Figure 13 shows the location of the Ajman Data Center facility. The infrastructure features to the far east of the site are an ongoing housing development. In this image, two construction clearings with material, vehicles, and equipment are visible in the central and southeastern portions of the image. The Etihad Water and Electricity Company (EtihadWE) Power Station is housed in the white-roofed rectangular facility to the northwest. At this point in time, the only signs of development are the temporary white storage units and the two fenced construction yards. Note that no official announcements had yet been made confirming this was the location of an upcoming data center.
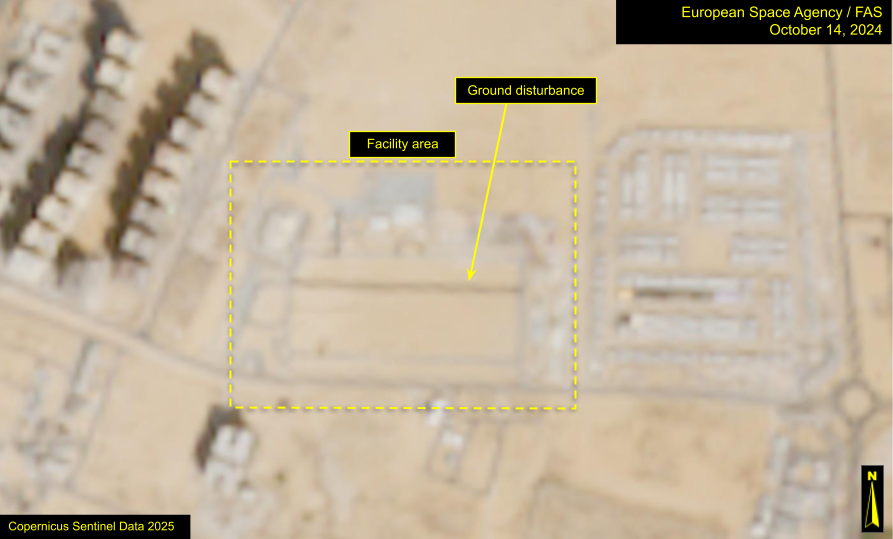
Fig. 14. Ajman Data Center site, October 14, 2024. Coordinates: 25°23’22.57″N, 55°34’44.82″E. Image © European Space Agency Copernicus Sentinel Data
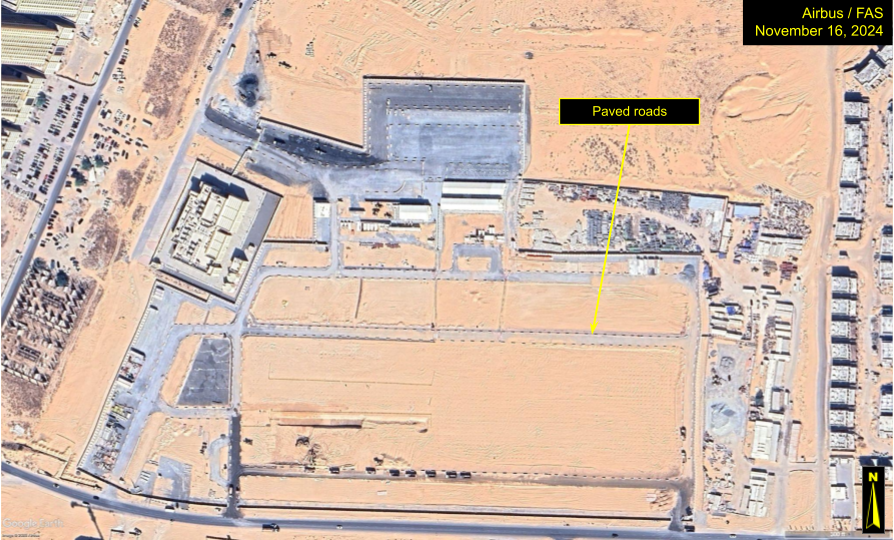
Fig. 15. Ajman Data Center site, November 16, 2024. Coordinates: 25°23’22.57″N, 55°34’44.82″E. Image: Google © 2025 Airbus
On October 15, 2024, Khazna formally announced the start of the Ajman Data Center project. According to the company, by October 15, the project had “broken ground” and was in the process of construction. “Breaking ground” is a subjective term, but typically refers to the start of official construction at a site, marked by the initial soil excavation and preparation. This commercial announcement is accurate: In Figure 14, October 14, 2024 Copernicus Sentinel-2 imagery (provided free of cost at lower ten-meter resolution via the Sentinel Hub) shows that the perimeter outline of the facility has been developed, and the dark brown linear feature within this perimeter is indicative of ground disturbances and corresponds accurately with the official announcement. Google Earth Pro shows higher-resolutionimagery for free, and the imagery available a month later (Figure 15) illustrates further detail in the development of the site, revealing that the dark linear feature from October 14, 2024 shows initial stages of a paved road. (Google Earth Engine does not display exact image resolution.)
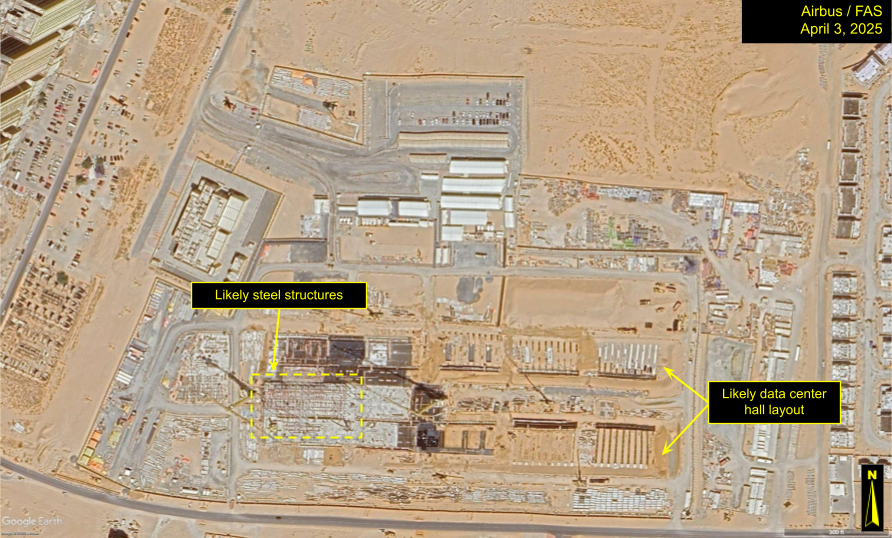
Fig. 16. Ajman Data Center site, April 3, 2025. Coordinates: 25°23’22.57″N, 55°34’44.82″E. Image: Google © 2025 Airbus
On April 21, 2025, a Khazna press release reported that the “steel structures” of the data center were complete. However, this does not appear to be accurate. As of April 3, 2025, it would not be possible for the steel structures to be finished. Figure 16 shows that the foundations of the building have not yet been fully laid, with large stretches of beige terrain visible to the east. Therefore, the steel structures were not finished at this point in time. The eastern portion of the building hall is clearly still in development. This illustrates that the press release was optimistic or strategically timed to signal that the construction was ahead of true progress.
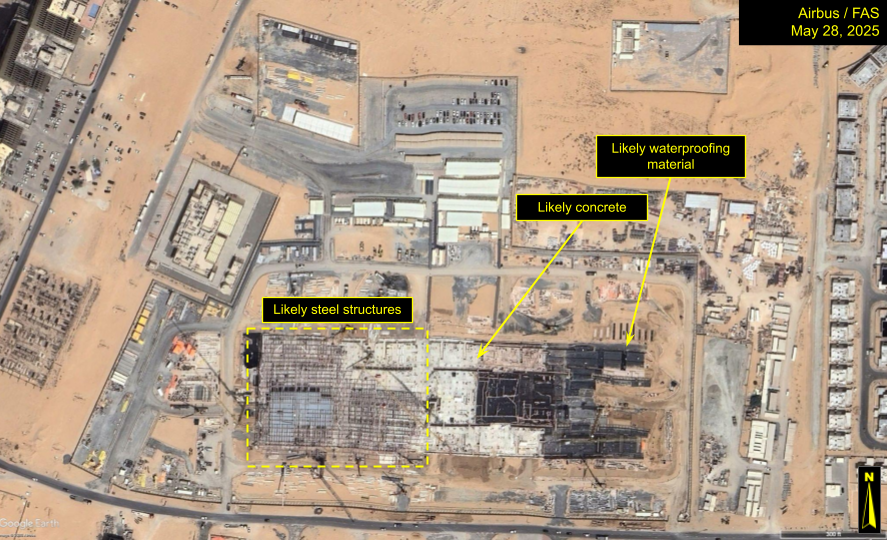
Fig. 17. Ajman Data Center site, May 28, 2025. Coordinates: 25°23’22.57″N, 55°34’44.82″E. Image: Google © 2025 Airbus
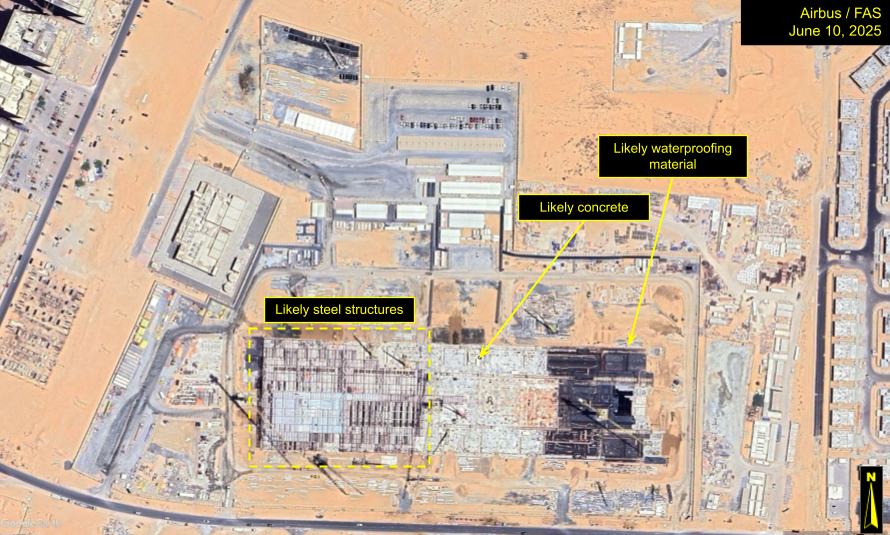
Fig. 18. Ajman Data Center site, June 10, 2025. Coordinates: 25°23’22.57″N, 55°34’44.82″E. Image: Google © 2025 Airbus
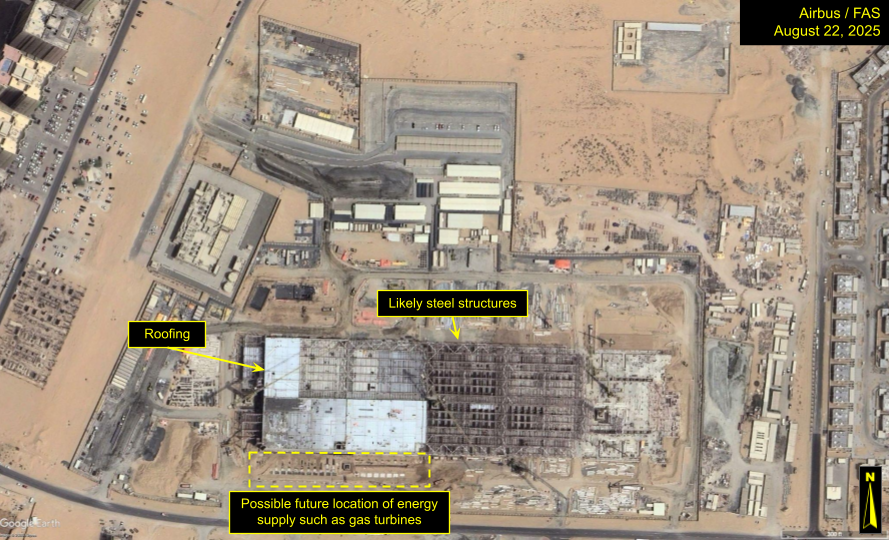
Fig. 19. Ajman Data Center site, August 22, 2025. Coordinates: 25°23’22.57″N, 55°34’44.82″E. Image: Google © 2025 Airbus
Significant construction progress is visible from May to August of 2025 (Figures 17, 18, and 19). Figures 17 and 18 show that the dark black foundational layer—likely asphalt or a waterproofing membrane—was overlaid with paler material, which are likely slabs of concrete. It is possible that Khazna defines “steel structures” as something different, and that the terminology may not refer to the thin metal support features that are visible on top of the foundational layer. However, if these metallic features are indeed “steel structures,” then they were only nearing completion around August 2025—far later than the April 2025 announcement. The steel structures may not even be entirely complete by the August 2025 image either, considering the easternmost portion of the main building still has pale foundational material entirely exposed.
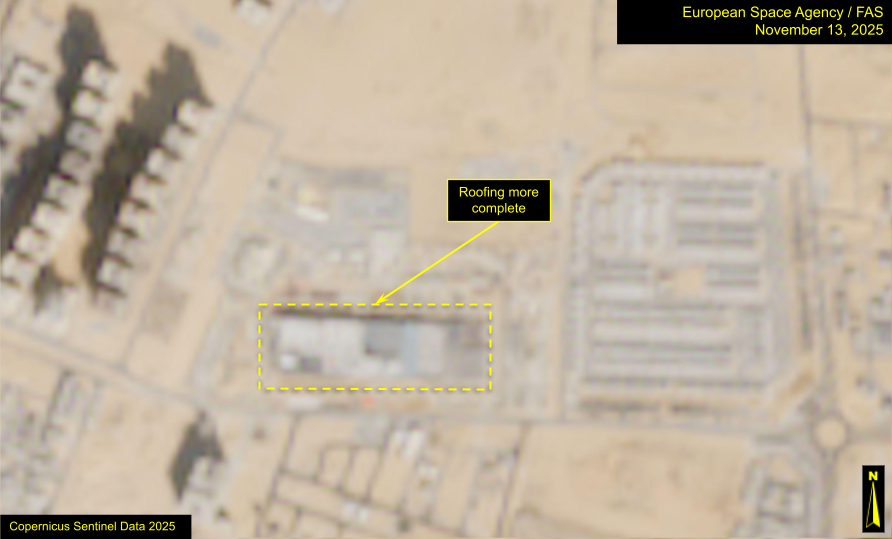
Fig. 20. Ajman Data Center site, November 13, 2025. Coordinates: 25°23’22.57″N, 55°34’44.82″E. Image © European Space Agency Copernicus Sentinel Data.
As of November 13, 2025, the rooftop shows significant progress.
The announced startup timelines for the site also changed over the course of construction. In the October 2024 announcement, the company stated that the facility would be “operational by Q3 2025” and “completed within 15 months,” placing the startup date sometime between July and September 2025. With most data center facilities taking between 18-30 months to complete (from “concept to commissioning”), this is an aggressive timeline. The satellite imagery also suggests that this compressed timeline is not feasible, since the construction was not on track with a Q3 2025 start date.
By the April 2025 update, Khazna stated that “the initial project phase is due for completion in December 2026.” While the meaning of “initial project phase” is subjective, for general completion of the facility, this is a much more realistic timeline and is accurately represented by changes in the imagery. This suggests that companies may be more marketing-focused at the beginning of construction, changing their estimations as projects progress.
Case Study 2. Feature Identification at xAI’s Colossus Data Center Facility
Background & Context
Epoch AI’s Frontier Data Centers Hub, released November 2025, analyzes over a dozen hyperscale data center facilities to track energy usage, construction timelines, and compute. One feature, the Satellite Explorer, provides high-resolution EO imagery annotations of critical infrastructure and tracks change over time. The author of this report contributed to the satellite imagery analysis and annotations for the Satellite Explorer, and this study selects one of the Hub’s data center facilities—xAI’s Colossus installation in Memphis, Tennessee—and discusses methods for feature identification, outlining how this methodology can be applied to other large-scale data center sites as well.
xAI’s Colossus supercomputer is run by a hyperscale data center facility in Memphis, Tennessee. The facility boasts a capacity of 200,000 GPUs and is one of the largest operational AI training clusters worldwide. At this size and scale, this installation is ideal for identification of expected features at completed hyperscale data centers. While this example on Epoch AI’s hub can also be used for tracking construction and buildout (similarly to Ajman), because the facility is operational, it is used in this report specifically for feature identification purposes.
Feature Identification
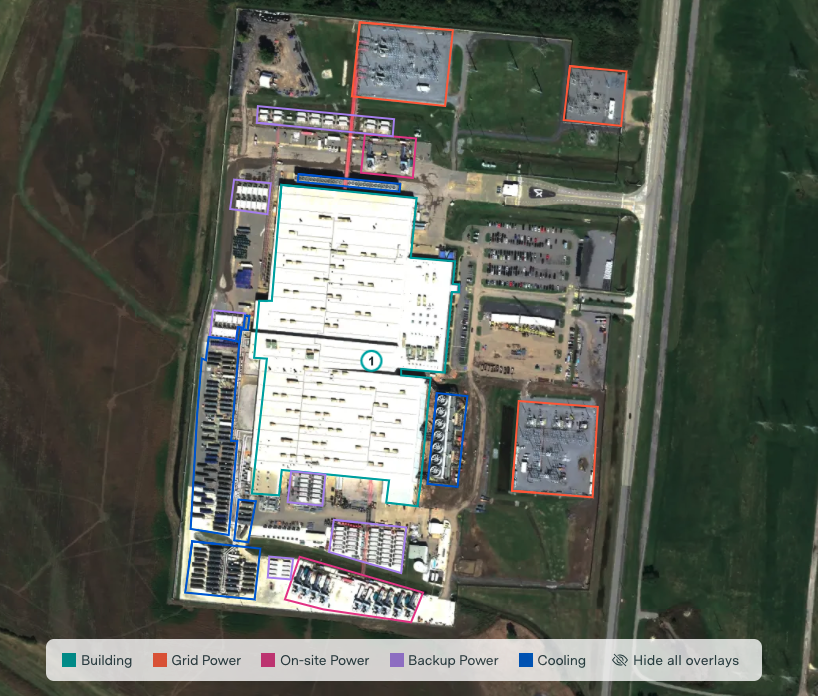
Fig. 21. Screen capture of xAI Colossus Data Center facility annotations within the Epoch AI Satellite Explorer, image dated October 19, 2025. Coordinates: 35°3’35.09″N, 90°9’22.33″W. Image © Airbus via Apollo Mapping.
Main Building
The main building at this facility is determined by its central location in the image, flat white reflective rooftop, and large footprint in comparison to the surrounding infrastructure. While this type of main data hall might not be immediately identifiable on its own, its proximity to the other infrastructure and its size indicates its status as the main building.
On-site Grid Power
Three substations are visible at this facility, outlined in Figure 21 in orange. Each of these three shows the expected visual signatures: they are rectangular, gray concrete lots with thin steel structures (that may throw stark, visible shadows across the lot if the sun is not directly overhead). These are the gantries, transformer blocks, and busbars. This identification is further validated by open sources (Figure 22): the Memphis Light Gas and Water (MLGW) publicly reported the location of two of the substations by using Google Earth satellite imagery and making its own annotations, outlining the substation locations.
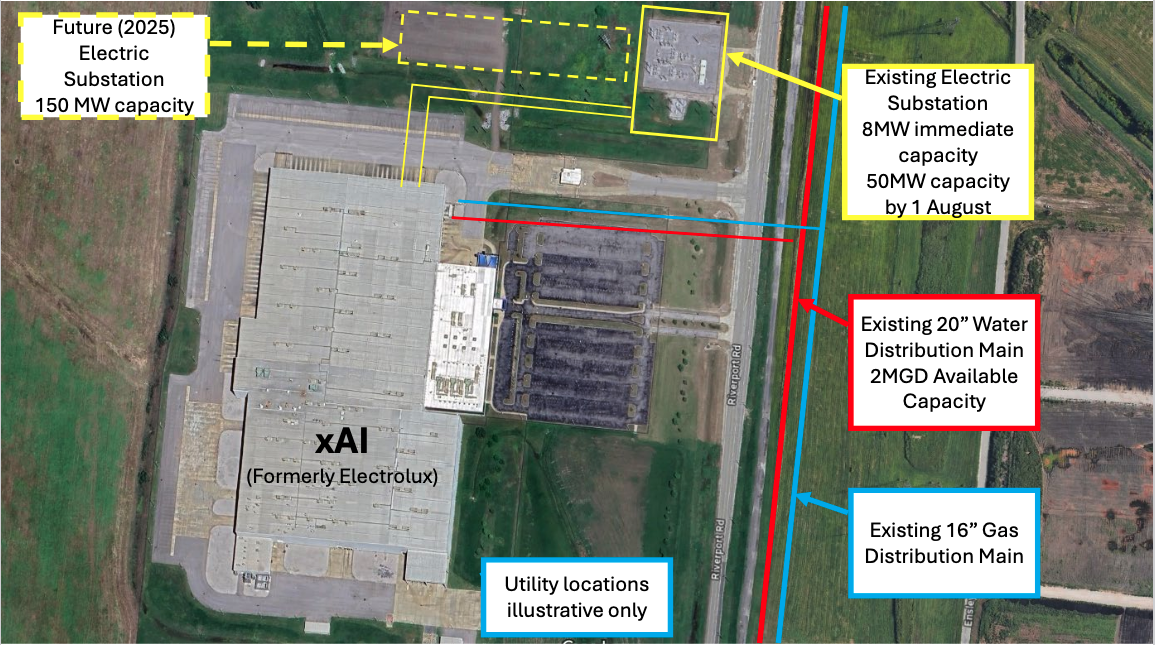
Fig. 22. Memphis Light Gas and Water (MLGW) imagery annotation and confirmation of xAI Colossus substation locations, July 9, 2024. Image date: April 17, 2023. Coordinates: 35°3’35.09″N, 90°9’22.33″W. Image: Google © 2025 Airbus
While it has its limitations, satellite imagery can be used for estimating power generation and capacity in some instances: for example, in July 2024, MLGW annotated Google Earth satellite imagery (Figure 22), revealing that the substation to the northeast of the facility had an 8 MW capacity and that the “future” substation located to the northwest would have 150 MW capacity. In Figure 21, a third substation located to the southeast is roughly the same size as the northwest substation. Therefore, it can be inferred that the third substation can also provide approximately 150 MW.
In May 2025, MLGW further announced that “xAI is receiving 150 MW of power at the Paul Lowry site. xAI requested an additional 150 MW at this location, for a total of 300 MW. A substation is being built to accommodate this request … MLGW anticipates that xAI will receive an additional 150 MW in Fall of 2025.” The announcement notes that 8 MW are being drawn from an “adjacent, pre-existing MLGW substation” (to the northeast) and 142 MW are being generated from the “newly constructed” substation (to the northwest). Therefore, the initial conclusion that the third southeastern substation has a capacity of approximately 150 MW was broadly accurate.
In this situation, EO imagery allows for the identification of the third substation and assists in energy estimations. However, it is only marginally accurate, since the northwestern substation is providing 142 MW and the southeastern substation will provide 150 MW. Therefore, exact estimations may not be feasible using satellite imagery.
On-site Main and Backup Power
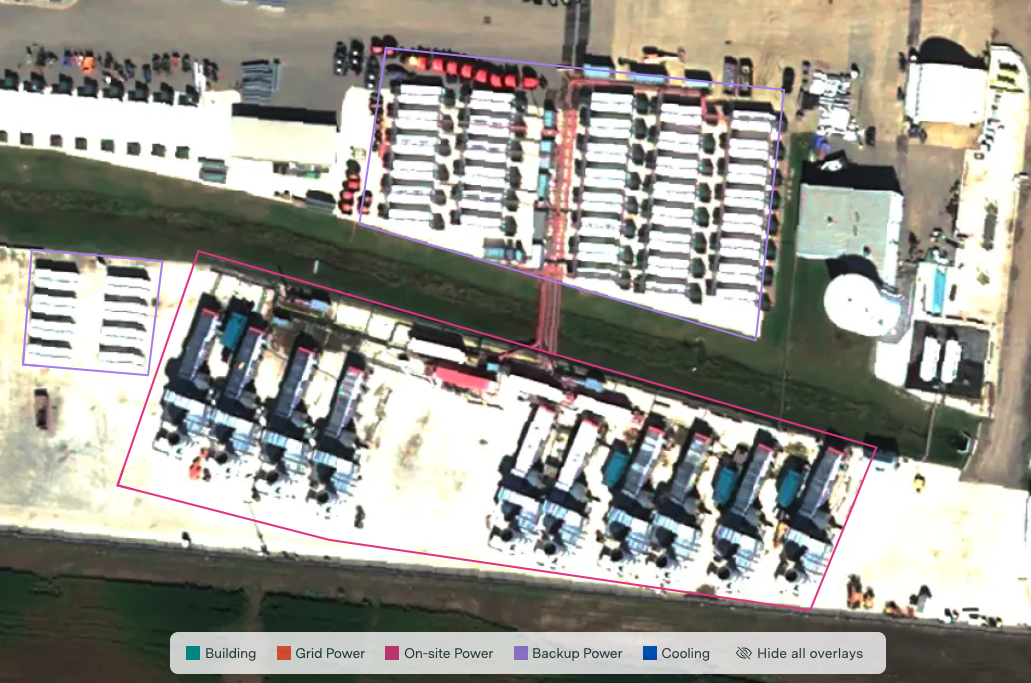
Fig. 23. Close-up of main and backup power infrastructure annotations within the Epoch AI Satellite Explorer, image dated October 19, 2025. Coordinates: 35°3’26.33″N, 90°9’22.48″W. Image © Airbus via Apollo Mapping.
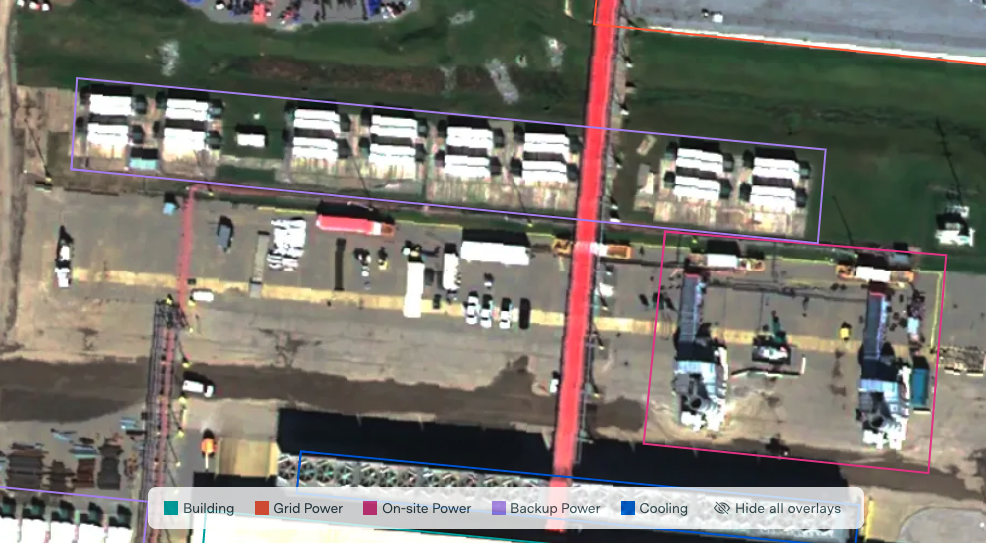
Fig. 24. Close-up of main and backup power infrastructure annotations within the Epoch AI Satellite Explorer, image dated October 19, 2025. Coordinates: 35°3’43.66″N, 90°9’21.15″W. Image © Airbus via Apollo Mapping.
Main (or on-site) power generators and backup generators will have differing visual indicators, as seen on Figures 23 and 24. For the Colossus facility, the main power generators are natural gas turbines. These types of turbines are distinguishable by the appearance of cylindrical exhaust stacks. In addition, just north of the exhaust stacks, square gray structures show the turbine air inlet filters. The turbines are also characterized by mushroom-cap-shaped features, visible north of the air inlet filters with appearances as white-blue horizontal structures with curved shadows to the north. These main power generators will also generally be grouped together and arranged in neat rows all facing the same direction.

Fig. 25. Gas turbine and backup power units visible in aerial imagery taken from the northeast looking southwest, image dated March 31, 2025. Image © Steve Jones Flight by Southwings for SELC.
In contrast, backup generators (outlined in purple in Figures 23 and 24) will show different visual indicators. They are smaller in size than the main power turbines, often rectangular in size and arranged in neat rows. They appear as pale-colored, container-like structures, and have no strong visual indicators. Long, rectangular white boxes in satellite imagery suggest the presence of backup generators such as these.
Identification of these gas turbines, over the course of 2025, was of particular use and interest to the Memphis local community. In 2024, xAI was offered permits for installing 15 temporary natural gas turbines at the site. However, by April 2025, 35 turbines were visible at the site, captured in aerial imagery. (Note that this was not satellite imagery, but imagery taken with an overhead airplane. This flyover was commissioned specifically for this purpose. However, satellite imagery can still be used to detect the quantity of turbines at the site.) These 35 turbines were in clear violation of the permitting rights that had been allotted to xAI. Following public complaints, xAI began dismantling the extra turbines. By July 2025, xAI was approved to have 15 permanent gas turbines on site. In Figure 21, dated October 19, 2025, 12 turbines are visible, implying that xAI is adhering to the legal allowance. This instance reveals how imagery can be utilized for ensuring that companies are complying with their legal commitments.
Cooling Infrastructure
Epoch AI’s recent work focuses particularly on using cooling infrastructure to make estimations on total cooling capacity and power consumption. This methodology has been demonstrated in the Frontier Data Centers Hub, which integrates satellite imagery, permitting documents, and company disclosures to model power, compute, and cost metrics across AI data centers.
Before calculations on energy output can be made, the cooling infrastructure must be identified and counted. Figure 21 shows the xAI Colossus cooling infrastructure outlined in blue. Close-ups are provided below in Figures 26 and 27.
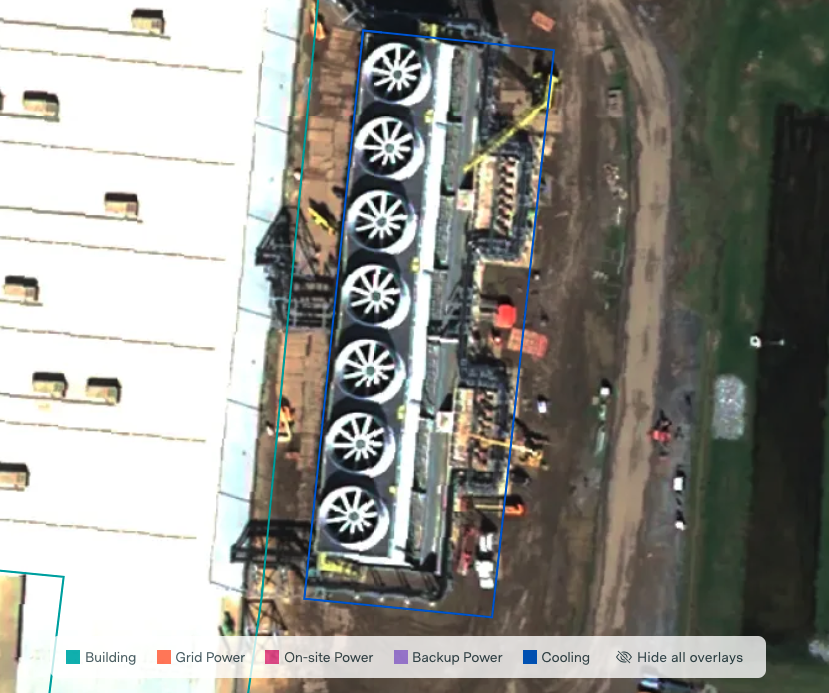
Fig. 26. Close-up of cooling tower infrastructure annotations within the Epoch AI Satellite Explorer, image dated October 19, 2025. Coordinates: 35°3’32.30″N, 90°9’18.87″W. Image © Airbus via Apollo Mapping.
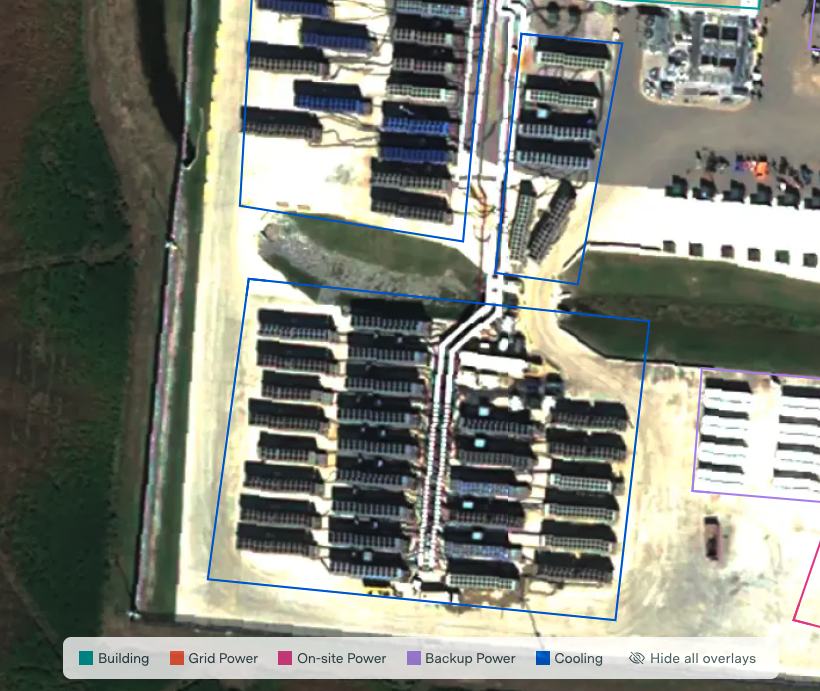
Fig. 27. Close-up of air-cooled chiller infrastructure annotations within the Epoch AI Satellite Explorer, image dated October 19, 2025. Coordinates: 35°3’26.41″N, 90°9’29.79″W. Image © Airbus via Apollo Mapping.
The Colossus data center facility is unique in that both cooling towers and air-cooled chillers are used. The cooling towers are more easily identifiable as large rectangular blocks with multiple circular fan features on top arranged in a row. The air-cooled chillers are often smaller in size than the cooling towers. They are also arranged in neat rows and also have many small fans on top (as opposed to the cooling towers, which show several much larger fans).
Counting the blocks of chillers and the cooling towers can then be used, as per the Epoch AI calculations, as inputs for quantitative power-capacity estimates. Epoch’s empirical models convert observable cooling infrastructure—such as the number and configuration of air-cooled chillers or cooling towers—into estimates of total cooling capacity and, from there, total facility power. For the Colossus facility, Epoch’s energy calculations and estimates range from approximately 200-500 MW, which is in line with the published expected capacity of 300 MW. While these estimations are broad and highly variable, Epoch’s work demonstrates how satellite imagery of cooling equipment can be used to infer broader operational characteristics of large AI data centers, even when direct disclosures are limited.
Support and Administrative Infrastructure
There is a large parking lot located to the west of the facility, visible as a large gray paved area with multicolored vehicles parked in lines. Just south of this parking lot, there is an additional unpaved open lot with white infrastructure, which are likely mobile container units. This area is likely being used for storage or other construction-related purposes. This is further evidenced by the open nature of the lot and the other mobile features parked in the area. This is notable due to the fact that, even as the building is operational, construction or upgrading activity may still be ongoing. Therefore, even after an official operational date is announced and comes to pass, this does not indicate the end of development activity at a site overall.
Key Takeaways & Analysis
Satellite imagery provides ground truth of construction progress, particularly when compared to official publications.
Commercial announcements cannot be solely relied upon for accuracy regarding the actual development of a data center site. Accuracy may be low due to changing construction plans, unscheduled delays, or intentional obfuscation. Early announcements can also function as publicity events. In the case of Ajman, illustrating that the “steel structures” claim is not consistent with ground truth helps to establish Khazna’s credibility and the reliability of future construction milestone announcements. In addition, these kinds of claims show that there could be a misalignment between understood definitions of “steel structures.” While they might refer to overall support structures, they might also be referring to other elements not yet visible at the site. This analysis ties the imagery observations to wider industry norms and shows that standard industry construction timelines are more realistic. Satellite imagery verification, therefore, reinforces these basic industry norms.
EO imagery is generally better for tracking construction (rather than ongoing activity) at data centers.
In the open source space, historical EO imagery is easier to obtain than new, up-to-date images, with providers making older imagery more readily available. Therefore, EO imagery is most easily integrated in the open source space to track changes over time. It is not well suited for identifying data centers from scratch or to track ongoing operations because A) the imagery is more difficult to access, and B) there are fewer large-scale infrastructural changes that occur at a data center facility once it has been completed. Construction changes take place over a wide stretch of land, making visible changes easy to track. Once a facility is operational, signs of ongoing activity might be limited to the presence of vehicles, which are by themselves not significant indicators of activity; they simply illustrate that staff is likely on site. Therefore, EO imagery is useful for tracking the construction and buildout of data centers over time.
Construction progress reveals internal building mechanisms and the schematics of data center halls.
In completed data center buildings, the internal arrangement of AI-related infrastructure is not visible. However, EO imagery can capture the foundations of the building in process of being built during construction. From this, it could be possible to estimate how many rows of racks will exist in the finished product. This could be used for estimations of total data center capacity.
This analytical process establishes a repeatable satellite imagery verification method for data center buildout.
Having satellite imagery for multiple construction stages shows, for future data center buildouts, that tracking the following infrastructural elements will give indicators as to the progress of the overall site. The established system for trackable developments is as follows:
- Site clearing;
- Data hall planning;
- Foundation work;
- Steel framing;
- Roofing;
- Cladding;
- HVAC, substations, and cooling; and
- Commissioning.
Analysts can use the tracking of these features to estimate how far along a construction project might be.
Satellite imagery should be analyzed in conjunction with other publicly-available information sources.
Satellite imagery does not exist in a vacuum; open sources can and should be utilized to support ground data. Satellite imagery, in the open source community, is the most useful when compared to other sources—particularly ground photos, videos, blueprints, maps, and other publicly-available satellite imagery. This is illustrated by the integration of open sources to the two case studies: for Ajman, the comparison of Khazna’s publications to satellite imagery exposed inconsistencies between commercial announcements and on-the-ground activity. In the Colossus case, publicly-available permit data outlined the legal limits of turbine installation, and Memphis Light Gas and Water’s open plans for development of the site, when compared to imagery, illustrated the potential size of the infrastructure and allowed for a general estimation of power capacity. Thus, open sources provide critical context and allow analysts to develop a deeper understanding of features and activities observed in satellite imagery.
Satellite imagery of data centers reveals some repeating patterns in expected infrastructure. Feature identification provides a means of independently verifying commercial activity.
EO satellite imagery is ideal for tracking large-scale construction and can be used to identify specific infrastructure features at data centers. These features—from gas turbines to switchyards to chillers—tend to have specific, visible patterns on satellite imagery that can be applied to the analysis of other data centers. While these features will not be the same at every data center, this guide serves as a starting point for analysis. The case of the xAI Colossus site is illustrative of the potential impact of imagery for tracking commercial activities. The unpermitted installation of gas turbines at the xAI site was discovered by overhead aerial imagery, prompting a public outcry and demands for the firm to adhere to their allotted quantity of turbines. The use of satellite imagery as recently as October 2025 shows that xAI has adhered to these restrictions and is operating below the allowed quantity of turbines. While overhead aerial imagery was used to initially discover this breach of contract, satellite imagery could have also been purchased and used for this purpose. Now, satellite imagery proves that xAI’s behaviors have altered and that they were responsive to complaints. Moving forward, satellite imagery can be used to continue to count turbines and identify other infrastructure, comparing permits to imagery to determine whether companies are adhering to their legal obligations.
Cooling infrastructure identification, measurement, and counting can be used for some energy calculations.
The identification of the natural gas turbines is particularly important for verification of commercial commitments to energy usage and environmental impact. A key takeaway, as discussed by Epoch AI, is the ability to use satellite imagery to calculate energy usage. The calculations are outside the scope of this report but can be explored through Epoch AI’s published methodology. This approach is analytically rigorous and innovative, and provides a useful starting point for understanding data center energy capabilities. However, as Epoch AI notes, there are limitations to this methodology. Firstly, it relies on the correct classification of cooling infrastructure, and these features can vary in appearance and visibility in satellite imagery. Some Amazon Web Services data center designs, for example, may not show clear cooling signatures. Additional uncertainty arises from various performance characteristics not being directly observable: while cooling towers themselves can be counted, their fan speed cannot be determined. To make calculations, Epoch AI selects specific parameters for cooling system performance based on known industry standards and infrastructure specifications. Thus, these measurements are best interpreted as approximations of capacity rather than exact measurements of operational energy use.
There are significant limitations to using EO satellite imagery for identification of data centers and their accompanying infrastructure.
One of the primary analytical challenges is determining whether an infrastructure feature is actually related to a data center facility as a whole. Not all of the aforementioned elements will necessarily be visible at a data center site. For example, not all facilities will have main power on site. Some will have power plants further away that supply the electricity, but they will not necessarily be in the vicinity of the data center itself. In addition, the construction of the infrastructure itself is variable; for example, fans and chillers may not look consistent across different companies or different countries.
Another challenge is the existence of infrastructure near a data center hall that is not related to the facility at all. There may be power supply and substations adjacent to a data center hall that has nothing to do with the data center itself and is being used for nearby unrelated facilities.
In addition, widely-available EO imagery, in general, shows only wavelengths of light visible to the naked eye. EO is unable to detect complex spectral signatures and can only view the outside of buildings. Therefore, it cannot provide information on internal infrastructure, including GPU clusters, racks, indoor chillers, or other equipment. This can sometimes be mitigated with historical construction imagery of a site: it can be possible to view, on the foundations of a main data hall, how racks are planned to be installed. Therefore, historical imagery might be used to predict future rack and cluster quantities.
Clouds, smoke, or other adverse weather conditions can also block infrastructure from being seen in EO imagery. The temporal frequency—or the time between image captures of the same location over Earth—is high enough that imagery could always be purchased, but this is a significant barrier to imagery being collected over particularly cloudy or rainy regions.
Satellite imagery is best suited for identifying activity at hyperscale data center sites. Smaller data centers can be housed in existing buildings in other corporate, commercial, or industrial sites, and may not show the distinctive features visible at the larger facilities. In addition, because of the variability of hyperscale data centers, it may not be feasible to identify hyperscale data centers from scratch without previously knowing their locations; while they have a large footprint, their buildings might be too generic to be identified with imagery.
In addition, the analysis of satellite imagery itself is a complicated art. The author is a trained imagery analyst and has years of professional experience with image interpretation. Understanding how to accurately analyze satellite imagery may be a barrier to entry for newcomers to the field, but this research is intended to serve as a starting point for those interested in developing these skills.
Finally, purchasing recent, high-resolution imagery is often prohibitively expensive, with each image costing anywhere from hundreds to several thousand dollars. This can be mitigated with freely available imagery online, but lacking the control over image capture dates and resolution is a significant drawback.
Recommendations
Recommendation 1. AI researchers and analysts can use this report as a guide for assessing data center buildout and operation.
Using both the established construction milestones and the identifiable features at completed data centers, the AI research community can reproduce these methodologies to compare construction milestones to commercial announcements, identify data center features, estimate buildout timelines, and evaluate potential energy usage requirements.
Recommendation 2. Policymakers should integrate satellite imagery monitoring into assessments of foreign and domestic hyperscale data center buildout to support energy planning, competition analysis, and strategic forecasting.
This is particularly useful for monitoring the progress of lower-transparency countries such as China, Saudi Arabia, and the UAE.
Recommendation 3. U.S. state governments and civil society actors should use EO imagery as a layer of independent verification to ensure that frontier AI data center developers are adhering to their legal obligations.
Comparing satellite imagery to permits, environmental claims, and commercial announcements can empower local communities to hold data center developers accountable.
Recommendation 4. International organizations should consider integrating satellite imagery as one element of verification for future international agreements.
As global discussions of international AI governance continue, satellite imagery should be included as a tool for independent verification of future agreements. The International Atomic Energy Agency has a satellite imagery analysis team for nuclear safeguards verification purposes, and this displays the efficacy of satellite imagery as one element of infrastructure development and operation evaluations.
Opportunities for Further Research
Future analysis could apply the principles developed in this paper to thermal infrared (TIR) imagery of operational data centers, as this type of sensor tracks and displays heat signatures. For example, the heat emitted by the walls and roofs of data halls, waste heat removed by chillers, and heat generated by electrical operation at substations and switchyards all are signatures that could potentially be visible in thermal infrared imagery. Commercial imagery provider SatVu in particular launched its second thermal infrared satellite, HotSat-2, on March 30, 2026. HotSat-2 has uniquely high-resolution capabilities for a thermal imaging satellite, providing up to 3.5-meter resolution. At this level of detail, useful building and other infrastructural signatures would likely be visible.
Additional research could also involve assessing the utility of other imagery sensors, such as synthetic aperture radar (SAR), multispectral, and hyperspectral imagery for tracking data center buildout and operation. On a larger scale, another avenue of research could explore how to potentially automate the detection of data centers; however, this would require high quantities of imagery for training data and a specifically-trained, accurate model. The difficulties of systematically distinguishing data centers from other industrial facilities is an additional challenge. Thus, while automated data center detection could be highly-desired as model capabilities develop, its practical implementation remains primarily conceptual at present.
Future research could also include comparing infrastructure of hyperscale data centers between different companies or different countries. For example, the infrastructural features at U.S.-based sites might have different overall patterns than those in the UAE or China. Satellite imagery provides a unique look into low-transparency countries, and understanding the infrastructure of international data center sites would provide insights as to the energy usage and overall capacities of existing and future facilities.
Conclusion
Data center facilities are critical to the successful operation of AI models, and their recent expansion reflects high interest in the continued development of these systems. However, despite public attention, key elements of data center construction and operation remain poorly understood due to a lack of publicly-available information, with corporate announcements being scarce and commercial timelines not necessarily reflecting true on-the-ground activity. This research demonstrates that EO satellite imagery can provide an independent, credible layer of insight regarding data center layouts, making it a valuable tool for verifying construction milestones and the presence of visible infrastructure rather than for measuring compute or internal activities.
The UAE Ajman Data Center case study exposes inconsistencies between construction milestone announcements and observable development progress, outlining the limitations of solely relying on corporate information for tracking data center buildout. At xAI’s Colossus facility in Memphis, EO imagery is used to identify specific features unique to data center facilities. In particular, the characteristics of power and cooling infrastructure support calculations of energy capacity and can be cross-referenced with public data such as permits and utility publications to ensure compliance.
While EO imagery is useful for tracking infrastructure-level developments, it is also limited by several constraints. It cannot be used to see the internal activity of data center facilities, and thus is ill-equipped to inform on GPU other compute activity. Current methodologies for estimating energy usage are still broad and exploratory, necessitating analytical inferences and requiring validation with other sources. Thus, satellite imagery should not be evaluated alone but should be treated as one of many analytical resources for assessing data center facilities.
These findings provide assessments to address global competition concerns, support evidence-based planning of industrial policies, and can contribute to longer-term international discussions of transparency and verification of AI-related infrastructure. From individual researchers to international organizations, satellite imagery can be integrated at many levels to support verification efforts as one facet of a larger toolkit of transparency-building measures.
Ultimately, this report illustrates where satellite imagery adds value—and where it does not—to inform future AI policy and governance efforts. As AI infrastructure expands, its physical signatures will continue to play a vital role in policy and regulatory discussions, and, when analyzed critically and integrated with other sources of data, it provides valuable, credible insight into the pace and scale of AI development.
Appendix
The United States’ biosecurity governance system is structurally incapable of detecting and responding to certain classes of threats. U.S. biosecurity tools have not kept pace with technological advancements or a changing threat landscape.
FAS and FLI partnered to build a series of convenings and reports across the intersections of artificial intelligence (AI) with biosecurity, cybersecurity, nuclear command and control, military integration, and frontier AI governance. This project brought together leaders across these areas and created a space that was rigorous, transpartisan, and solutions-oriented to approach how we should think about how AI is rapidly changing global risks.
AI is already consequential, but its future trajectory remains contested. Policymakers should make their assumptions explicit, focus on what can be shaped rather than what can be perfectly predicted, and build institutions that can learn and respond as evidence changes.
From grassroots community impacts to global geopolitical dynamics, understanding developing data center capacities is emerging as a critical analytical challenge.