


 According to the CIA World Factbook, the total population of North Korea was estimated at 21,386,109 as of July 1999. In their 1992 monograph, The Population of North Korea, Eberstadt and Banister placed the total population at 21.4 million persons in mid-1990. This figure is close to an estimate of 21.9 million persons for mid-1988 cited in the 1990 edition of the Demographic Yearbook published by the UN. Korean Review, a book by Pan Hwan Ju published by the P'yongyang Foreign Languages Press in 1987, gave a figure of 19.1 million persons for 1986. Eberstadt and Banister calculated the average population density at 167 persons per square kilometer, ranging from 1,178 persons per square kilometer in P'yongyang Municipality to 44 persons per square kilometer in Yanggang Province.
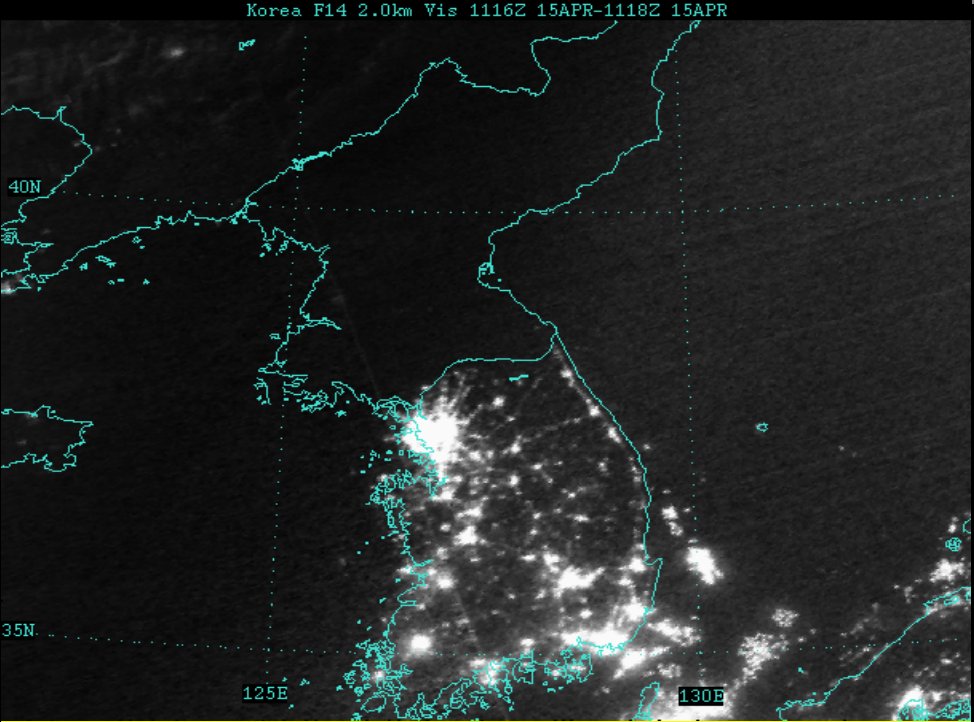
In 1987 North Korea's largest cities were P'yongyang, with approximately 2.3 million inhabitants; Hamhng, 701,000; Ch'ngjin, 520,000; Namp'o, 370,000; Sunch'n, 356,000; and Siniju, 289,000. In 1987 the total national population living in P'yongyang was 11.5 percent. Reliable estimates for urban populations are not readily available, and the United Nations Statistics Division's Demographic Yearbook 1998 does not even include an entry for North Korea. The government restricts and monitors migration to cities and ensures a relatively balanced distribution of population in provincial centers in relation to P'yongyang. North Korea's population is concentrated in the plains and lowlands. The least populated regions are the mountainous Chagang and Yanggang provinces adjacent to the Chinese border; the largest concentrations of population are in North P'yngan and South P'yngan provinces, in the municipal district of P'yongyang, and in South Hamgyng Province, which includes the Hamhng-Hngnam urban area. Urbanization in North Korea seems to have proceeded most rapidly between 1953 and 1960, when the urban population grew between 12 and 20 percent annually. Subsequently, the increase slowed to about 6 percent annually in the 1960s and between 1 and 3 percent from 1970 to 1987.
The rank-size distribution of cities is frequently described by a simple mathematical formula, which predicts the size of a given city by dividing the population of the largest city by the rank the rank of the city smaller city. The largest cities usually deviate significantly from the values predicted by the formula, a phenomenon known as the primate city. In the absence of more detailed city population estimates, this method may be used to approximate the distribution of the North Korean urban population. Not surprisingly for such a highly centralized society, Pyongyang demonstrates a rather marked "primate city" effect, and the populations of the cities with known population estimates are approximated by this method by applying a 2/3 fudge factor to the population of Pyongyang [which for this calculation is assumed to have a population of 1.5 million rather than 2.3 million].By this method, it may be estimated that there are a total of 15 cities in North Korea with a population in excess of 100,000, and another 15 cities with a population between 50,000 and 100,000. Urban areas with a population in excess of 50,000 would appear to account for roughly one third of the entire North Korean population.
| Rank | City | Actual | Calculated | Cummulative | Percent |
| 1 | Pyongyang | 2,300,000 | 1,541,000 | 2,300,000 | 10.7% |
| 2 | Hamhung | 701,000 | 770,500 | 3,001,000 | 14.0% |
| 3 | Chongjin | 520,000 | 513,667 | 3,521,000 | 16.5% |
| 4 | Namp'o | 370,000 | 385,250 | 3,891,000 | 18.2% |
| 5 | Sunchon | 356,000 | 308,200 | 4,247,000 | 19.8% |
| 6 | Sinuiju | 289,000 | 256,833 | 4,536,000 | 21.2% |
| 7 | 220,000 | 4,750,000 | 22.2% | ||
| 8 | 192,000 | 4,940,000 | 23.1% | ||
| 9 | 171,000 | 5,110,000 | 23.9% | ||
| 10 | 154,000 | 5,260,000 | 24.6% | ||
| 11 | 140,000 | 5,400,000 | 25.2% | ||
| 12 | 128,000 | 5,520,000 | 25.8% | ||
| 13 | 118,000 | 5,630,000 | 26.3% | ||
| 14 | 110,000 | 5,740,000 | 26.8% | ||
| 15 | 102,000 | 5,840,000 | 27.3% | ||
| 16 | 96,000 | 5,930,000 | 27.7% | ||
| 17 | 90,000 | 6,020,000 | 28.1% | ||
| 18 | 85,000 | 6,100,000 | 28.5% | ||
| 19 | 81,000 | 6,180,000 | 28.9% | ||
| 20 | 77,000 | 6,250,000 | 29.2% | ||
| 21 | 73,000 | 6,320,000 | 29.5% | ||
| 22 | 70,000 | 6,390,000 | 29.9% | ||
| 23 | 67,000 | 6,450,000 | 30.1% | ||
| 24 | 64,000 | 6,510,000 | 30.4% | ||
| 25 | 61,000 | 6,570,000 | 30.7% | ||
| 26 | 59,000 | 6,620,000 | 30.9% | ||
| 27 | 57,000 | 6,670,000 | 31.2% | ||
| 28 | 55,000 | 6,720,000 | 31.4% | ||
| 29 | 53,000 | 6,770,000 | 31.6% | ||
| 30 | 51,000 | 6,820,000 | 31.9% |